Glossary page H
Histogram
A graph for displaying the distribution of a measurement variable consisting of vertical rectangles, drawn for each class interval, whose area represents the relative frequency for values in that class interval.
To aid interpretation, it is desirable to have equal-width class intervals so that the height of each rectangle represents the frequency (or relative frequency) for values in each class interval.
Histograms are particularly useful when the number of values to be plotted is large.
Example
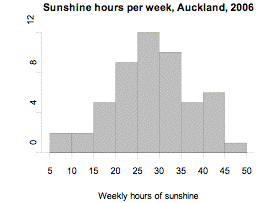
The number of hours of sunshine per week in Grey Lynn, Auckland, from Monday 2 January 2006 to Sunday 31 December 2006 is displayed in the histogram below.

If you cannot view or read this graph, select this link to
open a text version.
Curriculum achievement objectives references
Statistical investigation: Levels (4), (5), (6), (7), (8)
Last updated September 24, 2013
TOP


