Glossary page I
Independence (in situations that involve elements of chance)
The property that an outcome of one trial of a situation involving elements of chance or a probability activity has no effect or influence on an outcome of any other trial of that situation or activity.
Curriculum achievement objectives references
Probability: Levels 4, (5), (6), (7), (8)
Independent events
Events that have no influence on each other.
Two events are independent if one of the events has no influence on the probability of the other event occurring.
If events A and B are independent then:
P(A | B) = P(A)
P(B | A) = P(B)
P(A and B) = P(A) P(B), where P(E) represents the probability of event E occurring.
For two events A and B:
If P(A | B)= P(A) then A and B are independent events.
If P(B | A)= P(B) then A and B are independent events.
If P(A and B) = P(A) P(B) then A and B are independent events.
Curriculum achievement objectives reference
Probability: Level 8
Independent variable
A common alternative term for the explanatory variable in bivariate data.
Alternatives: explanatory variable, input variable, predictor variable
Curriculum achievement objectives reference
Statistical investigation: Level (8)
Index number
A number showing the size of a quantity relative to its size at a chosen period, called the base period.
The price index for a certain ‘basket’ of shares, goods, or services aims to show how the price has changed while the quantities in the basket remain fixed. The index at the base period is a convenient number such as 100 (or 1000). An index greater than 100 (or 1000) at a later time period indicates that the basket has increased in value or price relative to that at the base period.
Curriculum achievement objectives reference
Statistical investigation: Level (8)
Inference
See: statistical inference
Curriculum achievement objectives references
Statistical investigation: Levels 6, 7, 8
Interpolation
The process of estimating the value of one variable based on knowing the value of the other variable, where the known value is within the range of values of that variable for the data on which the estimation is based.
Curriculum achievement objectives references
Statistical investigation: Levels 7, (8)
Interquartile range
A measure of spread for a distribution of a numerical variable which is the width of an interval that contains the middle 50% (approximately) of the values in the distribution. It is calculated as the difference between the upper quartile and lower quartile of a distribution.
It is recommended that, for small data sets, this measure of spread is calculated by sorting the values into order or displaying them on a suitable plot and then counting values to find the quartiles, and to use software for large data sets.
The interquartile range is a stable measure of spread in that it is not influenced by unusually large or unusually small values. The interquartile range is more useful as a measure of spread than the range because of this stability. It is recommended that a graph of the distribution is used to check the appropriateness of the interquartile range as a measure of spread and to emphasise its meaning as a feature of the distribution.
Example
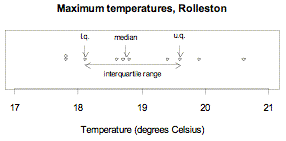
The maximum temperatures, in degrees Celsius (°C), in Rolleston for the first 10 days in November 2008 were 18.6, 19.9, 20.6, 19.4, 17.8, 18.1, 17.8, 18.7, 19.6, 18.8
Ordered values: 17.8, 17.8, 18.1, 18.6, 18.7, 18.8, 19.4, 19.6, 19.9, 20.6
The median is the mean of the two central values, 18.7 and 18.8. Median = 18.75°C
The values in the ‘lower half’ are 17.8, 17.8, 18.1, 18.6, 18.7. Their median is 18.1. The lower quartile is 18.1°C.
The values in the ‘upper half’ are 18.8, 19.4, 19.6, 19.9, 20.6. Their median is 19.6. The upper quartile is 19.6°C.
The interquartile range is 19.6°C – 18.1°C = 1.5°C
The data and the interquartile range are displayed on the dot plot below.

If you cannot view or read this graph, select this link to
open a text version.
See: lower quartile, measure of spread, quartiles, upper quartile
Curriculum achievement objectives references
Statistical investigation: Levels (5), (6), (7), (8)
Interval estimate
A range of numbers, calculated from a random sample taken from the population, of which any number in the range is a possible value for a population parameter.
Example
A 95% confidence interval for a population mean is an interval estimate.
See: estimate
Curriculum achievement objectives reference
Statistical investigation: Level 8
Investigation
See: statistical investigation
Curriculum achievement objectives references
Statistical investigation: All levels
Statistical literacy: Levels 1, 2, 3, 4, 5
Irregular component (for time-series data)
The other variations in time-series data that are not identified as part of the trend component, cyclical component, or seasonal component. They mostly consist of variations that don’t have a clear pattern.
Alternative: random error component
See: time-series data
Curriculum achievement objectives reference
Statistical investigation: Level (8)
Last updated October 9, 2013
TOP


