Glossary page Q
Qualitative data
Data in which the values can be organised into distinct groups. These distinct groups must be chosen so they do not overlap and so that every value belongs to one and only one group, and there should be no doubt as to which one.
Example
The eye colours of a class of year 9 students
Note: The curriculum usage of category data is equivalent to qualitative data.
See: category data
Curriculum achievement objectives reference
Statistical investigation: (Level 8)
Qualitative variable
A property that may have different values for different individuals and for which these values can be organised into distinct groups. These distinct groups must be chosen so they do not overlap and so that every value belongs to one and only one group, and there should be no doubt as to which one.
Example
The eye colours of a class of year 9 students
Note: The curriculum usage of category variable is equivalent to qualitative variable.
See: category variable
Curriculum achievement objectives reference
Statistical investigation: (Level 8)
Quantitative data
Data in which the values result from counting or measuring. Measurement data are quantitative, as are whole-number data.
Alternative: numerical data
See: measurement data, whole-number data
Curriculum achievement objectives reference
Statistical investigation: (Level 8)
Quantitative variable
A property that may have different values for different individuals and for which these values result from counting or measuring. Measurement variables are quantitative, as are whole-number variables.
Alternative: numerical variable
See: measurement variable, whole-number variable
Curriculum achievement objectives reference
Statistical investigation: (Level 8)
Quartiles
Numbers separating an ordered distribution into four groups, each containing (as closely as possible) equal numbers of values. The most common names for these three numbers, in order from lowest to highest, are lower quartile, median, and upper quartile.
The lower quartile is a number that is a quarter of the way through the ordered distribution, from the lower end. The upper quartile is a number that is a quarter of the way through the ordered distribution, from the upper end.
There are several different methods for calculating quartiles. For reasonably small data sets, it is recommended that the values are sorted into order (or displayed on a suitable graph) and then the median is calculated. This allows the distribution to be split into a ‘lower half’ and an ‘upper half’. The lower quartile is the median of the ‘lower half’, and the upper quartile is the median of the ‘upper half’. Use software for large data sets.
Note that different software may use different methods for calculating quartiles that may give different values for the quartiles. This is of no concern because in most cases any differences will be slight.
Example 1 (Odd number of values)
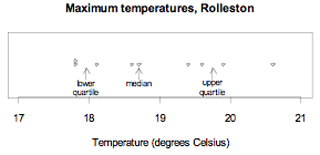
The maximum temperatures, in degrees Celsius (°C), in Rolleston for the first 9 days in November 2008 were: 18.6, 19.9, 20.6, 19.4, 17.8, 18.1, 17.8, 18.7, 19.6
Ordered values: 17.8, 17.8, 18.1, 18.6, 18.7, 19.4, 19.6, 19.9, 20.6
The median is 18.7°C.
The values in the ‘lower half’ are 17.8, 17.8, 18.1, 18.6. Their median is the mean of 17.8 and 18.1, which is 17.95. The lower quartile is 17.95°C.
The values in the ‘upper half’ are 19.4, 19.6, 19.9, 20.6. Their median is the mean of 19.6 and 19.9, which is 19.75. The upper quartile is 19.75°C.
The data and the quartiles are displayed on the dot plot below.

If you cannot view or read this diagram/graph, select this link to
open a text version.
Notice that there are 2 values below the lower quartile, 2 values between the lower quartile and the median, 2 values between the median and the upper quartile, and 2 values above the upper quartile.
Example 2 (Even number of values)
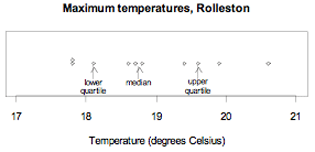
The maximum temperatures, in degrees Celsius (°C), in Rolleston for the first 10 days in November 2008 were: 18.6, 19.9, 20.6, 19.4, 17.8, 18.1, 17.8, 18.7, 19.6, 18.8
Ordered values: 17.8, 17.8, 18.1, 18.6, 18.7, 18.8, 19.4, 19.6, 19.9, 20.6
The median is 18.75°C.
The values in the ‘lower half’ are 17.8, 17.8, 18.1, 18.6, 18.7. Their median is 18.1. The lower quartile is 18.1°C.
The values in the ‘upper half’ are 18.8, 19.4, 19.6, 19.9, 20.6. Their median is 19.6. The upper quartile is 19.6°C.
The data and the quartiles are displayed on the dot plot below.

If you cannot view or read this diagram/graph, select this link to
open a text version.
Notice that there are 2 values below the lower quartile, 2 values between the lower quartile and the median, 2 values between the median and the upper quartile, and 2 values above the upper quartile.
See: median
Curriculum achievement objectives references
Statistical investigation: Levels (5), (6), (7), (8)
Questionnaire
A prepared set of questions used to obtain information from a group of people in a poll or survey. The quality of a questionnaire involves many desirable features including: unambiguous questions, accessible language, unbiased questions and clear instructions of how to respond.
Curriculum achievement objectives reference
Statistical investigation: (Level 7)
Last updated September 24, 2013
TOP


