Glossary page U
Uniform distribution (for a whole-number or discrete variable)
A theoretical probability distribution used as a model for a situation that produces a finite number of values (whole-number or discrete) and it is reasonable to assume that these values have equal probabilities.
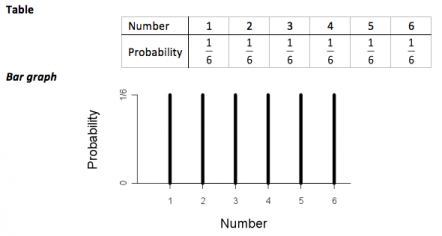
The name of the distribution comes from the uniform heights of the bars in the graph of the probability function.
Example
The following two displays show the probability function for a discrete uniform distribution used as a model for rolling a six-faced die and the random variable is the number facing upwards. The model assumes the die is fair.

If you cannot view or read this diagram/graph, select this link to
open a text version.
This model assumes that each roll is independent of all other rolls and that the probability of each number facing upwards is the same for each roll.
Curriculum achievement objectives references
Probability: Levels (7), (8)
Uniform distribution (for a continuous random variable)
A theoretical probability distribution used as a model for a situation that produces values in an interval of values and where it is reasonable to assume that all intervals of the same length (within the interval of all possible values) have equal probabilities.
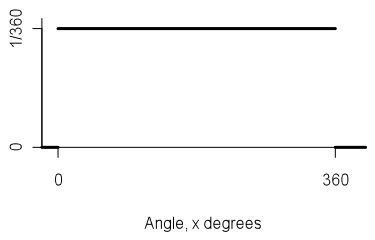
The name of the distribution comes from the uniform level of the graph of the probability density function.
Example
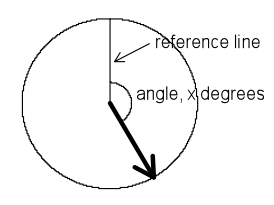
A continuous uniform distribution can be used as a model for a spinner and the random variable is the angle, in degrees, the spinner makes, in a clockwise direction, with a reference line.

If you cannot view or read this diagram/graph, select this link to
open a text version.
The probability density function is:

If you cannot view or read this diagram/graph, select this link to
open a text version.
This model makes several assumptions, including; the friction on the spinner is the same for all angles and that there is no pattern in the initial force used to start a spin.
Alternative: Rectangular distribution
Curriculum achievement objectives reference
Probability: (Level 8)
Upper quartile
See: quartiles
Curriculum achievement objectives references
Statistical investigation: Levels (5), (6), (7), (8)
Last updated September 25, 2013
TOP


