Glossary page O
Observational study
A study in which a researcher attempts to understand the effect that a variable (an explanatory variable) may have on some phenomenon (the response) but where the researcher is not able to control some important conditions of the study.
In an observational study, the researcher has no control over the value of the explanatory variable; the researcher can only observe the value of the explanatory variable for each individual and, if necessary, allocate individuals to groups based on the observed values.
Because the groups in the study are formed by values of an explanatory variable that individuals happened to receive, and not by randomisation, the groups may not be similar in all ways apart from the value of the explanatory variable.
Any observed differences in the response (if large enough) between the groups, on average, cannot be said to be caused by any differences in the values of the explanatory variable. The differences in the response could be due to the differences in the groups that are not related to the explanatory variable.
Example
A study by researchers at Harvard School of Public Health, published in 2009, investigated the relationship between low childhood IQ and adult mental health disorders. The study participants were a group of children born in 1972 and 1973 in Dunedin. Their IQs were assessed at ages 7, 9, and 11 and mental health disorders were assessed at ages 18 through to 32 in interviews by health professionals who had no knowledge of the individuals’ IQs or mental health history.
This is an observational study because the researchers had no control over the explanatory variable, childhood IQ. The researchers could only record the assessed childhood IQ. The response was whether or not the individual had suffered from a mental disorder during adulthood.
Curriculum achievement objectives reference
Statistical literacy: Level 8
One-way table
A table for displaying category data for one variable in a data set that displays each category and its associated frequency or relative frequency.
Example
Students enrolled in an introductory statistics course at the University of Auckland were asked to complete an online questionnaire. One of the questions asked them to enter their ethnicity. They chose from the following list: Chinese, Indian, Korean, Māori, New Zealand European, Other European, Pacific, Other. The 727 responses are displayed on the one-way table below.
Count of student ethnicity, survey responses.
| Ethnicity
| Chinese
| Indian
| Korean
| Māori
|
NZ
European
|
Other
European
| Pacific
| Other
| Total
|
| Frequency
| 169
| 58
| 56
| 18
| 253
| 45
| 38
| 90
| 727
|
Curriculum achievement objectives references
Statistical investigation: Levels (4), (5), (6), (7), (8)
Probability: Levels (3), (4), (5), (6)
Order (of a moving average)
The number of values used to calculate a moving average.
Curriculum achievement objectives reference
Statistical investigation: (Level 8)
Outcome
A possible result of a trial of a probability activity or a situation involving an element of chance.
Example 1
In a situation where a person is selected and their eye colour recorded, blue is an outcome.
Example 2
In a situation where two dice will be rolled and the numbers on each die recorded, a 1 on the first die and a 4 on the second is an outcome.
Example 3
In a situation where a person will be selected at random from a population and his or her weight recorded, 76 kg (to the nearest kilogram) is an outcome.
Curriculum achievement objectives references
Probability: Levels 1, (2), 3, 4, (5), (6), (7), (8)
Outlier
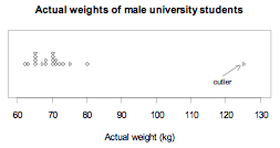
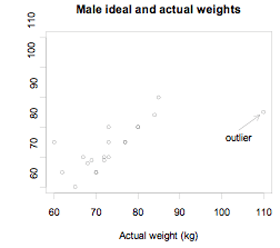
A member of a data set whose values for the variable in the data set are such that it lies well away from most of the other members of the data set.
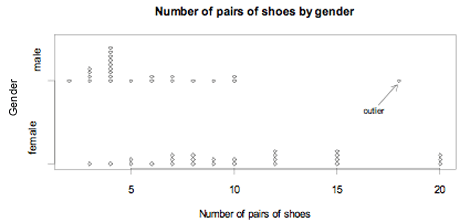
Outliers may occur with one or more numerical variables and may only be apparent when variables in the data set are separated out into the categories for one or more category variables, as in Example 3 below.
An outlier may be genuine, indicating an individual of particular interest. Alternatively, an outlier may be the result of a mistake, indicating that it should be checked out and, if possible, corrected.
Example 1
The actual weights of a random sample of 20 male students enrolled in an introductory statistics course at the University of Auckland are displayed on the dot plot below.

If you cannot view or read this diagram/graph, select this link to
open a text version.
Example 2
The actual weights and self-perceived ideal weights of a random sample of 20 male university enrolled in an introductory statistics course at the University of Auckland are displayed on the scatter plot below.

If you cannot view or read this diagram/graph, select this link to
open a text version.
Example 3
A random sample of 50 students enrolled in an introductory statistics course at the University of Auckland were asked about the number of pairs of shoes they have. The side-by-side dot plots below display the data for males and females.

If you cannot view or read this diagram/graph, select this link to
open a text version.
The male with 18 pairs of shoes is not an outlier when the 50 values are displayed on a single dot plot but is an outlier when the data are displayed by the two categories of gender.
Curriculum achievement objectives references
Statistical investigation: Levels (4), (5), (6), (7), (8)
Last updated October 16, 2013
TOP


