Glossary page N
Non-sampling error
The error that arises in a data collection process as a result of factors other than taking a sample.
Non-sampling errors have the potential to cause bias in polls, surveys or samples.
There are many different types of non-sampling errors and the names used to describe them are not consistent. Examples of non-sampling errors are generally more useful than using names to describe them.
Some examples of non-sampling errors are:
- The sampling process is such that a specific group is excluded or under-represented in the sample, deliberately or inadvertently. If the excluded or under-represented group is different, with respect to survey issues, then bias will occur.
- The sampling process allows individuals to select themselves. Individuals with strong opinions about the survey issues or those with substantial knowledge will tend to be over-represented, creating bias.
- If people who refuse to answer are different, with respect to survey issues, from those who respond then bias will occur. This can also happen with people who are never contacted and people who have yet to make up their mind about the answers.
- If the response rate (the proportion of the sample that takes part in a survey) is low, bias can occur because respondents may tend consistently to have views that are more extreme than those of the population in general.
- The wording of questions, the order in which they are asked and the number and type of options offered can influence survey results.
- Answers given by respondents do not always reflect their true beliefs because they may feel under social pressure not to give an unpopular or socially undesirable answer.
- Answers given by respondents may be influenced by the desire to impress an interviewer.
Curriculum achievement objectives references
Statistical investigation: Levels (7), (8)
Statistical literacy: Levels 7, (8)
Normal distribution
A family of theoretical probability distributions, members of which may be useful as a model for some continuous random variables. A continuous random variable arising from a situation that produces values that are:
- reasonably symmetrical about their average,
- have the most probable values occurring close to the average, and
- have progressively less probable values occurring further from the average
- can be modelled by a normal distribution.
Each member of this family of distributions is uniquely identified by specifying the mean µ and standard deviation σ (or variance σ2). As such, µ and σ (or σ2), are the parameters of the normal distribution, and the distribution is sometimes written as Normal(µ, σ) or Normal(µ, σ2).
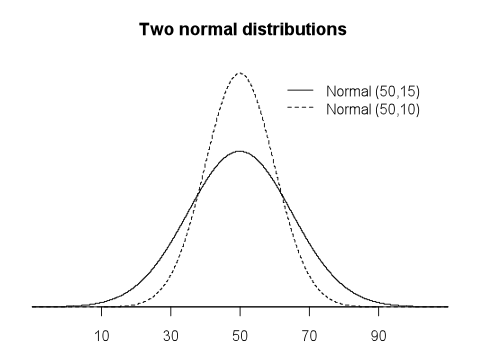
The probability density function of a normal distribution is a symmetrical, bell-shaped curve, centred at its mean µ. The graphs of the probability density functions of two normal distributions are shown below, one with µ = 50 and σ = 15 and the other with µ = 50 and σ = 10.

If you cannot view or read this diagram/graph, select this link to
open a text version
Alternative: Gaussian distribution
Curriculum achievement objectives references
Probability: Levels 7, 8
Numerical data
Data in which the values result from counting or measuring. Measurement data are numerical, as are whole-number data.
Alternative: quantitative data
See: measurement data, whole-number data
Curriculum achievement objectives references
Statistical investigation: Levels 2, 3, (4), (5), (6), (7), (8)
Numerical variable
A property that may have different values for different individuals and for which these values result from counting or measuring. Measurement variables are numerical, as are whole-number variables.
Alternative: quantitative variables
See: measurement variable, whole-number variable
Curriculum achievement objectives references
Statistical investigation: Levels (4), (5), (6), (7), (8)
Last updated October 16, 2013
TOP


