You are here:
- Home
- Mathematics and statistics
- Achievement objectives
- L7 learning experiences
Level 7 learning experiences
- M7-1 Apply co-ordinate geometry techniques to points and lines
Coordinate geometry
Task
- Given two points ((1,2) & (4,8)) investigate to find the midpoint, the distance between the points, the gradient of the line joining the two points, and the equation of the line.
- Using the methods developed from (1), generalise to find formulas for the midpoint, distance between points, gradient of the line forming the two points and the equation of the line given two points (x1, y1) and (x2, y2).
- M7-2 Display the graphs of linear and non-linear functions and connect the structure of the functions with their graphs
Graph transformations | Investigating algebra | Paper folding | Rental car rates
Graph transformations
Each of the following pieces of algebra draws a different shape.
a) y= x
b) y= x2
c) y = x3
d) y =
![]()
e) y= 2x
f) y =
![]()
g) y=
![]()
However, most algebra we see isn’t as simple as y = x2, it’s more like y = x2 + 2x + 1
Task
- Investigate by point plotting what happens to a graph if you put “+1” on the end of a piece of algebra.
- For example, y = x2 becomes y = x2 + 1
To do this:
- Point plot the graphs of:
- a) y = x + 1
- b) y = x2 + 1
- c) y = x3 + 1
- d) y =
 + 1
+ 1 - e) y = 2x + 1
- f) y =
 + 1
+ 1 - g) y =
 + 1
+ 1- = √x + 1
- Describe and contrast the graphs with the equivalent graph from above on:
- the shape
- the centre (note – the centre of the graph is normally the origin – in these cases comment on which point in the new graph has the point which used to be at the origin).
- a transformation that links the two graphs.
- At the end of the seven graphs write a statement about the effect of putting “+1” at the end of a piece of algebra.
- Predict what will happen if you put “+3” or “-2” at the end instead – then confirm your theory is correct by point plotting these also.
Write a general statement about the effect that adding a number to the end of a piece of algebra has on the graph.
Use the form if:
- y = f (x) is the basic shape
- y = f(x) +c is_____________
- Write a report of your findings of the transformations performed
What happens if instead of adding the one on last – you add 1 onto x before you do anything else.
For example: y = x2 becomes y = (x+1)2
Repeat the steps from question 1 to investigate, but write your own general statement about the effect of the transformation on the graph.
What happens if you put a negative sign on in front of the piece of algebra.
For example: y =
 becomes y = -

Repeat the steps, but write your own general statement about the effect on the graph.
What happens if instead of adding a number you multiply by a number (try using 2 because it is easy!)
For example: y = x3 becomes y = 2x3
Again repeat the steps from question 1 to investigate, using only whole numbers and simple fractions for part 4, then write your own general statement about the effect on the graph.
Extension
With the negative sign put in front of the piece of algebra (that is the sign is changed as the last thing you do) you discovered it resulted in a certain transformation.
What would happen if you changed the sign first?
For example: y = x3 becomes y = (-x)3
- i) Predict the outcome and confirm it by testing your theory on 4 separate pieces of algebra.
- ii) Write a general statement regarding the change to the piece of algebra.
With the multiplied number stuck in front of the piece of algebra (that is things are, say, double after everything else has been done) you discovered it resulted in a certain transformation.
What would happen if you multiplied by a number first?
For example: y = x becomes y = 2x
Repeat the steps from question 5 to investigate.
Teacher notes
- This investigation is a useful starting point for considering the impact of the form of the algebra on the algebraic processes you can use.
- Students will also get to the point where they can actually identify their own weaknesses with powers, fractions and integers – if you tell them NOT to use calculators in working out the y values.
Setting question 1 as homework then recapping on what was discovered in class works well. From there set a “predict and confirm” follow-up exercise in class.
That is: Look at the piece of algebra
- predict the: shape
- centre
- (other transformations)
Then confirm by point plotting.
Subsequent days can be used for 2, 3 and 4.
Quick plotting techniques for different graphs can also be introduced on an on-going basis.
- For example: y = x2 ; squares of numbers; (0,0) (1,2) (2,4) and their negatives
- xy = 1; numbers multiplying to give 1; (1,1) (2, ½) (½, 2) and their negatives
Good students should be encouraged to predict, sketch and confirm rather than sketch and confirm.
- For example: y = x2 ; squares of numbers; (0,0) (1,2) (2,4) and their negatives
- Combined transformations is a logical extension.
Investigating algebra
A maths teacher claims that the most important feature in a piece of algebra is the highest power of x in it, as it determines the nature (or shape) of the relationship involved.
Task
- Investigate this claim by point plotting various powers of x. Include whole number, integer and fractional indices but keep the piece of algebra in the form y = xa
- Consider alternative algebraic forms like y = 2x, y= log x, y = 3√x, xy = 1 and x2 + y2 =1 in your investigation.
- Write a report detailing your findings, either supporting or refuting the claim of the maths teacher.
Paper folding
An introduction of exponential functions and standard form.
- How thick is a sheet of paper?
- How could we measure the thickness?
- What is the maximum number of times that you can fold a sheet of paper in half?
Get students to guess and then carry out the activity.
If you drilled down through your pile of paper, how many holes would you make in the sheet of paper? (How many sheets high is the pile of paper)?
If we started with a huge sheet of paper and folded it 40 times how high would the pile be? Get the students to estimate or guess the height from possible answers such as: up to the top of the whiteboard, up to the ceiling, up to the top of a 10 story building, as tall as Mt Ruapehu, Mt Aorangi, Mt Everest etc.
Teachers notes
Parts of the above activity could be left for students to explore but with the average ability students this work could be done as a class investigation led by the teacher.
One way of finding the thickness of a sheet of paper is to find the thickness of a pile of sheets of paper. A ream of photocopying paper (500 sheets) is about 50mm high, so each sheet is about 0.1mm thick.
The maximum number of folds for a sheet of paper is about 7.
To find the thickness in sheets requires the students to realise that each fold doubles the number, some will have built up a table at this stage.
Graph thickness in sheets against the number of folds.
The thickness in sheets for n folds is 2n.
By noting that as n increases by 1 the thickness is doubled it follows that as n decreases by 1 the thickness is halved, so values can be found for 2-1 and 2-2.
Show the students how to evaluate 2n on the calculator, show the students that 20.5 and 20.1 etc. can be evaluated, so that smooth curve can now be drawn for -2 ≤ x ≤ 5
To find the thickness for 40 folds, evaluate 240 which is 1.1 x 10⁸ thicknesses
- = 1.1x 10⁸m
- = 1.1 X 10⁵ km
- = 110 000km
which is approximately
![]() of the distance between the earth and the sun.
of the distance between the earth and the sun.
Rental car rates
Task
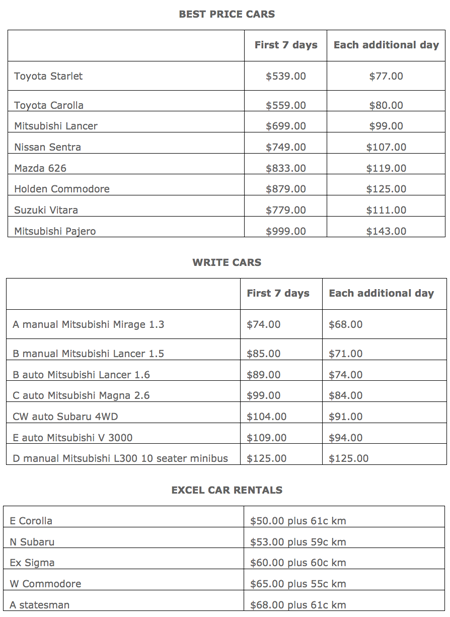
Obtain information about costs for rental cars from several rental car firms. Alternatively use rates provided below. Students should compare costs from at least two different firms. Equations for costs should be written for both and graphs drawn to show the cheaper option for all distances travelled.
Students may wish to compare camper van rental rates instead or two different types of car from the same firm.
- Under what conditions do the companies charge the same?
- When is it cheaper to use one company instead of the other?
- M7-3 Use arithmetic and geometric sequences and series
Bouncing balls | Car depreciation | Dear Aunt Lucy | Interesting curves
Investments and loans | Mortgage payments | Population explosion
Powhiri investigation | Saving to study | Skyscraper | Tax It! | Word of mouth
Bouncing balls
Resources
Balls, measuring equipment
Task
A ball is dropped from a height of 1m. Estimate the total distance that the ball travels before it comes to rest.
Investigate different heights that the ball is dropped from.
- It would pay to do each height two or three times to allow students some way of estimating height.
- Average the ratio between 1st and 2nd bounces, 2nd and 3rd etc
Car depreciation
Start with: What is depreciation? (initial discussion)
Investigate the depreciation of a new car. Is there an equation that can model the value of a car as it gets older? Does the same mathematical model fit all makes/styles of car? What factors will need to be taken into account in estimating a car’s value? Start with price information from newspapers, Motoring Guide, Trade Me etc.
Dear Aunt Lucy
Aunt Lucy is a seventy year old who has decided to leave some money to her niece Kerry. She gives Kerry four options of how she can have the money. Kerry has to decide which option she will take.
Option 1: $1000 this year, $900 next year, $800 the year after…
Option 2: $100 this year, $200 next year, $300 the year after …
Option 3: $100 this year, 1.5 times this the following year…
Option 4: $10 this year, $20 next year, $40 the year after…
Interesting curves
Resources
Photocopied sheet, construction equipment
References
- Mathematical models – Cundy and Rollett
- The mathematical tourist – Peterson
Task
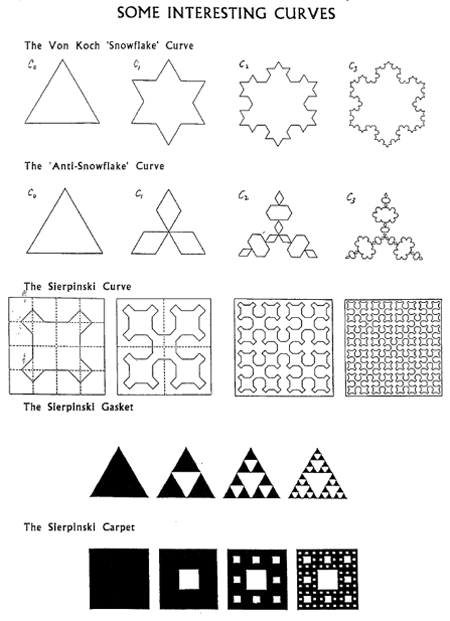
Investigate some (one/all) of the following curves. Hint: construct the pattern yourself and using your knowledge of perimeter/area work out a pattern.
- Von Koeh “Snowflake” Curve Investigate what happens to the perimeter and area
- The “Anti-Snowflake” Curve Investigate what happens to the perimeter and area
- The Sierpinski Curve Investigate what happens to the perimeter and area
- The Sierpinski Gasket Investigate what happens to the shaded area
- The Sierpinski Carpet Investigate what happens to the shaded area
Investments and loans
Investigate and compare different ways of investing and/or loaning money. Different individuals or groups within the class could present findings on different ways of investing money and comparisons would be made in a discussion and report back session. Methods could include: investment accounts, simple and compounding accounts (compounding accounts with different compounding periods), shares, lotto, bank loans, mortgages of different types, student loans, hire purchase.
Task
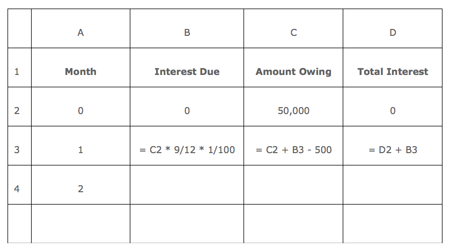
- Use spreadsheet or calculations to work out the amount owing after each of the first four repayments.
- How long would it take to repay the loan?
- They want to repay the loan within five years. How could they do that? (Increasing payments, fortnightly payments).
Teacher
- Set up as is for monthly. Then get kids to set up spreadsheet for fortnightly payments (without scaffolding).
- Investigate the differences between.
Mortgage payments
Resources
Calculator, computer (spreadsheet)
Activity
To investigate the difference between repaying a loan monthly or fortnightly.
A $50,000 loan is to be repaid. The annual interest rate is 9%. Repayments are made of $500 per month. Interest is added monthly.
Task
- Use a calculator to work out the total amount owing at the end of the first month, after adding interest and the deducting the $500 repayment.
- Repeat for the next three repayments. Keep a record of the total interest.
Set up a spreasheet to investigate the total interest repaid:
- Calculate the repayments if made on a fortnightly basis and repeat the spreadsheet for fortnightly repayments.
Population explosion
Investigate the effects of different sized families on the population growth rate. The ‘mini-world’ will have a starting population of eight couples. A number of assumptions will be made:
- Every couple has children
- In each generation half the children are boys and half are girls
- Everyone marries
- People only die of natural causes
- On the birth of a new generation, their great-grandparents die of old age
Investigate what happens if each couple has 2 children, 4 children, 6 children.
Powhiri investigation
A Kaumatua (elder) who speaks at a powhiri (welcome) recites his whakapapa (genealogy) during his whaikorero (speech). His mokopuna (grandchild) is asked to keep count of all his tupuna (ancestors) that his grandfather has mentioned.
The Kaumatua recites with exact detail 50 generations of his ancestral tree, starting with Rangi (the sky father) and Papa (the earth mother). The mokopuna notices that every odd generation contains 7 ancestors and every even generation has 2 x n ancestors (where n is the generation in which the Kaumatua is reciting). However, generations divisible by 5, contain 4 ancestors only.
If the mokopuna is part of generation 52 and future descendants also follow the same pattern as previously, how many people have descended from Rangi and Papa by the end of the 52nd generation?
Use this as a discussion point on how to create a pattern of values to generate a sequence.
Saving to study
A family sets up a savings plan for Sylvia’s tertiary education, starting at her first birthday. $1,000 is paid into the fund on each birthday. Interest at 8% per annum is paid once a year. How much will the savings be worth when Sylvia turns 18?
The family starts a saving plan for Maturanga, but does not start the scheme until Maturanga’s fifth birthday. They want Maturanga’s savings to have the same value as Sylvia’s by his 18th birthday. How much should they pay at each birthday?
You are the lucky recipient of one of these funds. You want to draw the same amount each month for three years (36 monthly payments starting form your 18th birthday). If interest of 0.75% per month, calculated monthly is paid, how much should you receive each month?
What is the 0.75% monthly interest as a per annum interest?
Skyscraper
Activity
A calculator will be helpful in solving these problems.
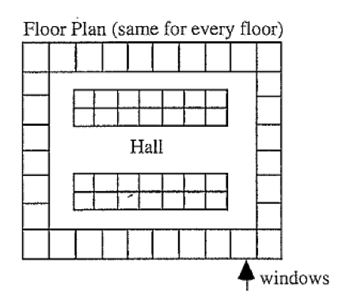
Once a year all the windows are washed. The costs are:
$2 for each 1st floor window
$2.50 for each 2nd floor window
$3 for each 3rd floor window etc- a) How much would it cost to wash a window on the 10th floor?
- b) How much would it cost to wash a window on the nth floor
- c) How much does it cost to have all the windows washed?
- d) Investigate the cost for a skyscraper with x windows on each side and y floors high.
All inside offices (those without windows) rent for $125 per month.
Outside offices rent for:
$150 per month on 1st floor
$160 per month on 2nd floor
$170 per month on 3rd floor etc.- a) How much rent is collected from the 10th floor?
- b) How much rent is collected from the nth floor?
- c) What is the total rent per month?
- d) Investigate the total rent for a sky scraper with x windows on each side and y floors high.
Tax it!
In Dugland the government wishes to discourage gambling while at the same time raising a little revenue for itself. To do this they put a 10% tax on all forms of gambling. This tax is charged every time a bet is made regardless of whether the punter wins or loses. Winnings, profits and administrative costs must all come from the remaining 90%.
Jacko is a very keen gambler and has learned an infallible system for winning the game “cardshark”. Unfortunately this game is not the richest one in the world, as it only returns the money you put into it – minus the tax of course.
- If the minimum bet in “cardshark” is $1, investigate how many times Jacko can play the game if he starts by betting $10 and puts his ‘winnings’ on for another game.
- Jacko’s winnings are worked out using a calculator. Any fraction of a cent is chopped and goes to the bank as profit. Investigate Jacko’s winnings game after game, keeping a record of how much the banker is ‘creaming’ from the total. Present your results in the form of a table.
- Explain what happens to Jacko’s money, with the help of a graph and appropriate mathematical language, if he continually plays “cardshark”.
Word of mouth
“Word of Mouth” advertising happens when a satisfied customer recommends a business service to friends or acquaintances.
In a particular business, each satisfied customer introduces one new customer two weeks after using the business and one more new customer each week after that. Assume all new customers are satisfied.
- If this business starts with just one customer, how many satisfied customers will there be after 10 weeks?
- Investigate how the answer changes if each satisfied customer tells twice as many people as in the original problem (i.e. 4 after 2 weeks and 2 every week after that) or three times as many as in the original problem (i.e. 6 after 2 weeks and 3 every week after that).
OR
Decide on your own “Word of Mouth” model (for example, telling one new person each week) and work out the number of satisfied customers there will be after 10 weeks.
Compare the different word of mouth models.
- M7-4 Apply trigonometric relationships, including the sine and cosine rules, in two and three dimensions
Height measurement | How far is it | Navigation problem | Sand | Sine rule introduction | Spherical shapes
Height measurement
Resources
Measuring Tape, Trundle Wheel, Metre rule, clinometer
Activity
To measure the height of an object (tree, building, flag pole etc.) by using right angled trigonometry and then non-right angled trigonometry.
Task
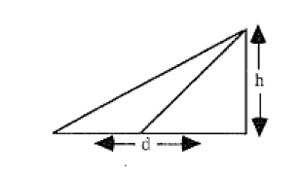
- Use a clinometer to measure the angle of elevation to the top of the object and measure the distance from observer to the foot of the object. Use right angled trigonometry to find the height.
- In a situation where it is not possible to measure the distance to the foot of the object (a river, crevasse etc.), measure two separate angles of elevation find the distance between the two positions of the observer use the appropriate trigonometry to find the height of the object.
How far is it
This activity is a useful introduction for the cosine rule. It raises student’s misconceptions about other triangle formulae.
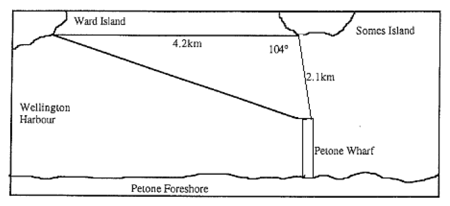
Draw a sketch with a context, such as the one below, on the board at the start of the lesson.
(This sketch should be of a non-right angled triangle with one angle and the two sides touching the angle given).
The students must use any method they can to calculate the length of the unknown side. In this case, they must find the distance from Ward Island to Petone Wharf.
After five or so minutes, when they have decided on and started using some method, it is useful to stop for a discussion about the methods they are trying. This will enable you to discuss some issues the problem raises (some students will be wrongly using Pythagoras SOH CAH TOA…) and will enable students without a method to make a start.
When they have worked out a distance, collect answers on the board and discuss methods and results.
By this stage the students are likely to tell you that their methods take a long time and are generally not very accurate. They will often say that there must be a better way…which is…
A GREAT time to tell them about the cosine rule! They can then use it to calculate the distance they have just worked out, and this time they will all get (hopefully) the same answer!
Navigation problem (Cosine rule)
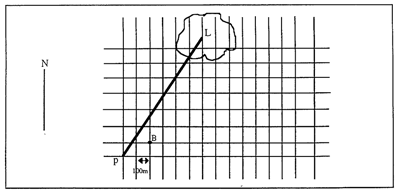
- Find the length from Port (P) to the Lighthouse (L).
- A Boat (B) has left Port and is positioned on the grid such that the vector
 describes its movement. Find the bearing this boat is travelling at.
 - What is the angle formed between the path of the boat and the line between Port and the Lighthouse?
- Using the Cosine Rule a2 = b2 + c2 + 2bc cos A, find the length between the Boat and the Lighthouse.
- Fill in the table below by using the above method.
Extension
If the closest distance of the Boat to the Lighthouse is 940m, find the distance of the Boat from the Port. Write down all your working.
Sand
Any particles allowed to build up into a pile will form a cone with a natural angle of incline depending on their size. Students can find this natural angle of various particles. For example: sand, salt, sugar, silt or small pebbles. Some further investigations can be carried out on the correlation between particle size and angle.
Sine rule introduction
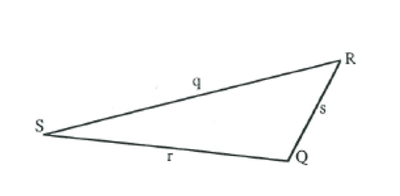
- Each student needs to draw a large triangle. The aim is to have triangles of many different shapes in the classroom.
- Students label the sides and vertices of their triangle.
- Students measure the lengths and angles and record:
q = r = s =
Q = R = S =
Calculate:

- By examining their own results and discussing their results with others, students should have discovered the sine rule.
- Students should use their findings to solve these problems.
- They must explain the method they used to find solutions.
- Students should be encouraged to use other method(s) to check their solutions.
Spherical shapes
Use a collection of balls from the physical education department. Mark two points on the surface of each of the balls. For each ball, find the distance, s, between the points and find the radius. Use these measurements to find the angle in radians between the points and the centre of the ball. Repeat using a globe to find the angle between two places in radians from the centre of the earth.
- M 7-5 Choose appropriate networks to find optimal solutions.
Road race
Resources
Photocopies of local road maps.
Task
- Plan a 10km road race and display it on the map given to you. Where possible, it should contain flat and slightly hilly sections, and should be a circuit, so the finish is the same place as the start.
- On another map establish the traffic routes and diversions that will be in place during the race.
- Identify how long the race will take for fastest and slowest competitors, and from this information establish how long the diversions will need to be in place.
Present your answers in the form of a City Council advertising poster.
Traffic flows
Resources
Local road map.
Task
- Investigate the public transport options and the traffic flows in your area. Display your findings on 2 maps – one for public transport, the other for traffic flows (Note: you are expected to invent a method of showing flows of different density).
-
Decide the optimal route from____________ to___________ given that:
a. You are an 80 year old who can’t walk very far.
b. You are a pedestrian wanting the shortest route.
c. You are a cyclist scared of cars.
d. You are the driver of a fire engine travelling to a fire.
e. You are a student going Christmas shopping.
Choose 3.
- M 7-6 Manipulate rational, exponential, and logarithmic algebraic expressions.
- M 7-7 Form and use linear, quadratic, and simple trigonometric equations.
- M 7-8 Form and use pairs of simultaneous equations, one of which may be non-linear.
- M 7-9 Sketch the graphs of functions and their gradient functions and describe the relationship between these graphs.
Oil spills
This is a practical activity to help investigate the spread of oil in an oil spill.
Resources/equipment
Small scale graph paper, petri dish, stop watch, eye dropper, cooking oil, water (distilled, tap, dirty, sea, hot, cold…)
Method
- Put water in petri dish over graph paper.
- Using the eye dropper, drop oil onto the water.
- Time the oil spread to different diameters.
- Investigate the relationship between time and area of oil and between time and diameter of the spread.
- Different groups investigate different types of water.
- Write up your results in a written report. Include data and any graphs you have drawn.
Alternative investigation
Use one type of water and several types of oil.
Rates of change
Investigate rates by sketching graphs for these situations. Justify the shape of the graph and comment on the rates of change.
- I dropped my hammer from the roof.
- A train increased speed until half way between two stations, and then slowed down to a stop.
- A parachutist travelling from the plane to the ground.
- The temperature in an oven as it heats up.
- A toddler climbing up the steps of a slide and sliding down.
- $100 is to be shared out evenly amongst members of a group. The amount of money each person in the group gets according to how many are in the group.
- The circumference of a balloon at its middle as it is blown up.
- The distance between two points on the balloon surface (the big bang theory).
- M 7-10 Apply differentiation and anti-differentiation techniques to polynomials.
Box construction | Fencing problems | Maximising the volume of a rectangular box | Packaging investigation | Tennis ball drop
Box construction
Resources
- Wire
Task
You have 60cm of wire to construct the frame of a rectangular box. If the box is to be twice as long as it is high:
- Make a box using 60cm of wire.
- Find the volume of the box.
- If the height of the box is x, find an expression for the length, width and volume of the box in terms of x.
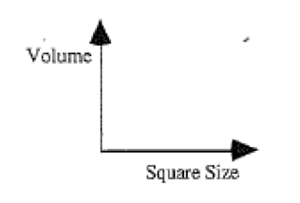
- Find the height of the box used by each of the other groups and the volume of their boxes. Graph height vs volume.
- Are the dimensions of your box the only solution to the problem? Investigate and display graphically.
- Could you make a box with the maximum volume given the restrictions above? Explain and justify your answer.
Fencing problems
Find the area of a paddock if you have 100m of fencing and:
- the length is twice the width
- the length is 10m longer than the width
- one of the sides is an existing fence
- what is the greatest area that can be enclosed with 100m of fencing?
- what is the smallest area that can be enclosed with 100m of fencing?
Maximising the volume of a rectangular box
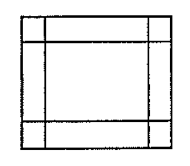
- You are given a sheet of paper 20cm by 20cm. Make it into the open top box that will give the biggest possible volume.
- What size square cut out of each corner gives us this maximum volume? Complete the table below to show this.
- Display your results graphically.
- Use calculus to determine this maximum volume.
Packaging investigation
Packaging of many products influences a person’s idea of the quantity they are buying.
Resources
A range of boxes, for example, Kentucky Fried, chocolates, toothpaste, Milo…
Method
- Choose a box.
- Calculate the volume of the box.
- Dismantle the box so you can lay it out flat to form a net.
- Establish the dimensions to find the maximum possible volume for the box that could be made from the card.
Use these dimensions to find the maximum possible volume for the box that could be made from the card.
Is the manufacturer getting as much product into the container as possible?
Justify your answer.
Tennis ball drop
Resources
Stairs, tennis ball, Stop watch
Task
Cavers and miners often throw a stone into a crevasse and listen for the splash to estimate the height. Climb some stairs at school. Drop a tennis ball and record the time it takes to hit the ground. Estimate the height that you dropped the ball from.
This is really a practical activity which illustrates anti-differentiation.
Students will need to be familiar with:
- gravity = -9.8m/s2 = acceleration
- velocity = -9.8t m/s
- distance = -4.9t2 m
Development band
Justify the formulae for velocity and distance using integration.
- S 7-1 Carry out investigations of phenomena, using the statistical inquiry cycle:
- A – conducting surveys that require random sampling techniques, conducting experiments, and using existing data sets
- B – evaluating the choice of measures for variables and the sampling and data collection methods used
- C – using relevant contextual knowledge, exploratory data analysis, and statistical inference
House prices | How random is random? | NCEA results are better | Planning a statistical investigation | Scarves | Starter statements | Teenage sports and leisure
House prices
Comparing house prices in two different areas (for example, Khandallah v Newtown).
Resources
Computers (but not essential). Property Press. Trade Me.
Task
Investigate the house prices in two different areas (data could be provided).
- Pose a comparison investigative question.
- Make a plan to collect a sample of houses from each area.
- Collect the data (could be provided).
- Display the data using multiple displays.
- Describe the data commenting on shape, central tendency, shift, overlap, spread.
- Make an informal inference.
- Draw conclusions.
- Present your findings in a report.
How random is random?
Resources
Random tables, calculators
Task
You may feel you can choose numbers at random just as well as random number tables.
- Write 100 numbers from 0-9 “at random” (quickly write these as they come into your mind).
- Use a random method (tables, calculator, 10-sided dice) to select another sample of 100 numbers from 0-9.
- Display both sets of results on a frequency table and comment on your results.
NCEA results are better
Resources
NCEA level 1 maths results for 2 years (10 years or so apart)
Task
NCEA level 1 mathematics results are better now than ten years ago. Results for both years are provided.
Using an appropriate sampling method, investigate this hypothesis, displaying results appropriately and writing a conclusion.
Planning a statistical investigation
Task
Design a simple questionnaire for one of the following topics or one of your own choosing. It needs to have as a target population, students.
Pilot your questionnaire on 5-10 students.
As a result of your pilot comment on any shortcomings in your questionnaire and suggest improvements.
Suggested topics:
- Smoking
- Uniform
- Attitudes to school
Scarves
Peter and Gina are planning to set up a small business selling personalised scarves. They plan that some will have names on them and will be custom made, while others will have the names and colours of rugby clubs, schools, etc. However, before spending a lot of money to set up they want to undertake some market research to see if there is demand for their product.
- Identify their target market/s
- Create a market research plan that will allow Peter and Gina to do the following:
- a) Discover the demand for their product
- b) Identify the sort of client interested in such a product
- c) Identify how they should distribute their product
- d) Discover what people are prepared to pay for their product.
Be prepared to report your plan to the class for comment.
Teacher notes
This activity is designed to lead into a class discussion about target and sampled populations, sampling strategies and questionnaires.
Starter statements
Use the following as statements to challenge the students. They may personally agree or disagree, but they should investigate each and state whether it is correct or not.
- More people have their birthday in spring (Sept/Oct/Nov) than any other season.
- More people watch TV 2 than any other channel.
- People who play musical instruments have longer fingers than people who do not play musical instruments.
- 91ZM is the most popular radio station.
- There are more blue cars on the road than any other colour.
- More people watch Shortland Street than watch Masterchef.
- McDonald’s is the most popular fast food outlet.
- 20 % of students at this school bike to school.
- More people prefer wholemeal bread to white bread.
- Chocolate is the most popular flavour of icecream.
Teenage sports and leisure
George Hama wishes to open a shop selling sports equipment and games to teenagers.
Before he opens his shop he wishes to do some market research to ensure there is a market for his product.
- Discuss in your group how George can conduct his market research, in preparation for oral feedback to the class.
- Write a questionnaire that George could use to collect the sort of information he would need prior to deciding whether or not to open a shop.
- S 7-2 Make inferences from surveys and experiments:
- A – making informal predictions, interpolations, and extrapolations
- B – using sample statistics to make point estimates of population parameters
- C – recognising the effect of sample size on the variability of an estimate.
- S 7-3 Evaluate statistically based reports:
- A – interpreting risk and relative risk
- B – identifying sampling and possible non-sampling errors in surveys, including polls.
Newspapers
From newspapers investigate the different ways the media present statistical information. Find at least five different situations. Analyse the method of presenting statistical information. How effective if the chosen method? Are there any deliberate misrepresentations of the statistics?
- S 7-4 Investigate situations that involve elements of chance:
- A – comparing theoretical continuous distributions, such as the normal distribution, with experimental distributions
- B – calculating probabilities, using such tools as two-way tables, tree diagrams, simulations, and technology.
Animals | Beetles │ Birdstrike | Conditional probability starter │ Crazy caramel cards | McDonald's | Population | Probability trees for conditional probabilities |
Animals
Simulate the density of an animal population in relation to its nest. For example: bees, wasps or ants. The school field is marked with pegs so students can see how far they are from the nest. They face a random direction and toss a pair of dice. If the total of the dice is less than the distance they are from the nest they move one metre towards the nest otherwise they move away. After about ten turns students should be normally distributed from the nest.
Beetles
Equipment
Dice (1 per 2 students)
Before starting tell everybody about the beetle game. A lot of children do play it.
To build a beetle you throw a die.
1 – gives the body
2 – gives the head
3 – gives eyes (x2)
4 – gives the tongue (x1)
5 – gives antennae (x2)
6 – gives legs (x6)
- You must get the body first
- You cannot add eyes, tongue and antennae until you have the head.
Lesson
At a stall at the school gala you want to make money out of building beetles.
For $1.00 you play the game.
- If you go over “A” throws you lose your money.
- If you get from A to B throws you get your money back
- If you get under B throws you get $5.00 in return.
Let your class guess what A and B should be. Record in two stem and leaf plots. Now give them the dice and let them play two games against their partner, recording their throws, that is, 1, 3, 4, 2, 3, 3, 6, 2, 5
- Collect the class results.
- How could they improve their estimates of A and B?
- Can they simulate using technology?
Birdstrike
Resources
4 coins per team. 4 dice per team. Random number tables (or scientific calculators).
When a jet flies into a flock of birds, there is a probability that the engines will fail due to birdstrike.
Suppose a jet has 4 engines, and the probability that each engine suffering birdstrike is independent. Also suppose that a plane has to make an emergency landing if at least 2 engines are affected, and will crash of at least 3 engines are out of action.
Task
- Design a simple probability experiment that will simulate the number of engines that will fail in a birdstrike if the probability of an engine being struck is
 . Describe your model and explain why it is appropriate to the task.
 -
Carry out your experiment, systematically record your results hence calculate the probability that:
a) an aeroplane has to make an emergency landing
b) an aeroplane crashes. - Explore the effect of having a lower probability of an engine failing on the results of the question. (Explain how you simulate such probabilities clearly and concisely).
- Try to generalise your results for the number of engines failing provided you are given a particular probability of engine failure.
Conditional probability starter
Equipment
Two bags containing different numbers of white and black marbles.
Find the probability that given you choose a Black marble, what is the probability that it came from bag A?
Your solution should include a probability tree.
Crazy caramel cards
The situation
Each bag of Crazy Caramels contains one famous mathematician card.
There are six types of cards:
- Hypatia
- Maria Angesi
- Emili du Chatelet
- Emmy Noether
- Ada Lovelace
- Sophie Germain
They are uniformly distributed in the Crazy Caramel bags.
Student tasks
- If you want a complete set of cards (and are lucky), what is the fewest number of bags you need to buy?
- Now make a guess as to how many bags on average you think you will have to buy to get a complete set of Crazy Caramel Cards.
Teacher
- Record class guesses on the board.
- Find mean and median of their guesses.
Student tasks
- How could we model this situation? (The buying of the Crazy Caramels to get the cards).
Teacher
- Record ideas on the board. These could include: names out of a hat, random numbers, (table or calculator), dice.
- Select one of these methods to model this situation (suggest dice).
Students tasks
- Use a die to model this.
- Let the numbers one to six stand for a mathematician.
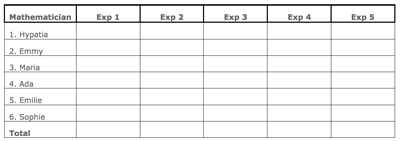
- Roll the die recording your results as you go in a table like the one below. Continue rolling the die until you have at least one of each card. Record the total.
- Repeat the experiment until you have completed five.
- Find the average of your five results.
- Compare your average with your guess. How close were you to your guess?
Teacher
- Collect all student averages and find the class average
- Get students to compare their guess with the class average.
- Compare the class guess average with the class results average.
McDonald's
Resources
1 dice per person.
McDonald’s is giving away free plastic toys with each purchase. There are four in the set and they are given out randomly each visit. On average how many visits will it take to collect all four figures for your young sister?
Task
- Take a die and work out how many rolls it takes for each number to come up. (use a 4-sided die; or a 6-sided and only use numbers 1-4).
- Repeat number 1 often enough so you can calculate how many times you need to roll the die (on average) so all the numbers come up.
- Combine your results with others doing the same activity to improve the accuracy of your result.
- Explain why die rolling is an appropriate way to simulate getting toys from McDonald’s.
Population
Obtain the information about the life cycle and the mortality rate of a species of animal. For example: the kiwi or the blue whale. With this information simulate the growth or decline of the species. For example: The Great Probable Bird (alias the Great Tit). Half the adult population dies over winter. Each spring it lays on average 10 eggs, but only 84% of these hatch and of these only 70% last to autumn. Throughout the winter only 10% of these birds survive to reproduce the following spring.
Probability tress for conditional probabilities
Choose one of the following stories, A or B. Construct a tree diagram to illustrate the situation. Investigate the probabilities of each of the possible outcomes.
A: A fisherwoman sets out on a fishing voyage with 10 tins of her favourite food in the hold; 5 tins of baked beans, 3 tins of pineapple and 2 tins of beetroot.Just after setting out the boat is caught in a wild storm. Water gets into the hold and all the labels wash off the tins.
The cold, hungry woman selects first one tin, and then another to make up her dinner. Investigate the possible meals she may have, and their probabilities.
B: Indiana Jones has to get across the jungle. There are two tracks and Indiana flips a coin to decide which track to take. What he doesn’t know is that the left hand track goes through a swamp with quicksand. There is a 30% chance of disappearing in the sand.The right hand track has two hazards; if Indiana manages to avoid being eaten by tigers (the probability of avoiding the tigers is 1/3) he still needs to distract the headhunters because the track goes through their camp. The probability of being caught by headhunters is 20%.
Calculate the probability of Indiana Jones successfully crossing the jungle.
- Make up your own probability story. It must have at least two stages, and it must be imaginative. Swap probability stories with another and solve one another’s by drawing tree diagrams and investigating probabilities.
Supermarket queues
A small supermarket has four checkouts. In quiet times only one of these will be open, in busy times all four will be open. Extra checkouts are only opened when the queue in any one lane reaches five people.
Customer research has shown that, on average it takes 1.5 minutes to serve a customer and that the shop has quiet periods and busy periods. In a quiet period up to 6 shoppers arrive at the checkouts every 3 minutes and in the busy periods up to 10 shoppers arrive every 3 minutes.
-
The supermarket opens with one checkout in operation as early in the day customer numbers are low. Investigate the customer flow in the supermarket by running the following simulations.
a. Toss a die to simulate the number of shoppers arriving at the checkouts in a 3 minute period
b. Set up the following table to look at the first hour of business
- Investigate when the system will come to equilibrium if the maximum of 6 shoppers arrive every 3 minutes.
- Summarise your findings.
- An hour after opening is the first of the busy periods. Continue your simulation from number 1 for another hour, using a ten sided dice or random numbers.
- Customers start to complain if they have to wait longer than 10 minutes. If busy periods are never longer than 2 hours at a time, investigate the need for an extra checkout by using both your simulation and an appropriate distribution model. Report your findings.
Last updated September 11, 2018


