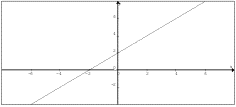
Achievement objective M8-10
In a range of meaningful contexts, students will be engaged in thinking mathematically and statistically. They will solve problems and model situations that require them to:
- identify discontinuities and limits of functions.
Indicators
- Links features of graphs with the limiting behaviour of functions.
- Uses limiting features of functions to sketch graphs.
- Finds limits algebraically, graphically, and numerically by considering behaviour such as:
- x approaches a specific value from above and below
- x tends towards +∞ or -∞
- Demonstrates understanding of continuity at a point (the limit as x tends to a of f(x) = f(a)).
- Identifies discontinuities graphically or algebraically.
- Informally links concepts of continuity and differentiability
M7-9.
- Determines the continuity and differentiability of a function.
- See
key mathematical ideas on NZmaths.
Progression
M8-10 links from
M7-9,
M8-2,
M8-7.
Possible context elaborations

If you cannot view or read this equation,
open this text version.

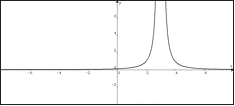
 does not exist. This limit does not exist since the limit from the left decreases without bound and the limit from the right increases without bound.

 This means the limit does not exist but that we know about the behaviour of the function as x approaches 3. The function does not approach a number from both sides, but it tends to +∞ (that is, the function increases without bound) from both sides of x = 3.
If you cannot view or read this equation,
open this text version.

If you cannot view or read this graph,
open this text version.
- Sketch of f(x) = x , x < 3 and f(x) = x + 2, x ≥ 3 and comment
 does not exist and so it is discontinuous at x = 3.
- Discontinuities shown by a graph with a jump, for example, piecewise function.
- Discontinuities shown by a graph with a hole, for example, y=(x2-1)/(x-1) which has a hole at x=1.
-
Graf it: Exploring unfamiliar graphs.
Assessment for qualifications
NCEA achievement standards at levels 1, 2 and 3 have been aligned to the New Zealand Curriculum. Please ensure that you are using the correct version of the standards by going to the
NZQA website.
The NZQA subject-specific resources pages are very helpful. From there, you can find all the achievement standards and links to assessment resources, both internal and external.
The following achievement standard(s) could assess learning outcomes from this AO:
Last updated September 16, 2018
TOP


