Achievement objective M7-2
In a range of meaningful contexts, students will be engaged in thinking mathematically and statistically. They will solve problems and model situations that require them to:
- display the graphs of linear and non-linear functions and connect the structure of the functions with their graphs.
Indicators
- Demonstrates understanding of functions and the relationships between the graph of functions, y=f(x), and the graphs of their transformations of the form y= Af(x-B) +C. Functions include:
- quadratics
- cubics
- polynomials of degree of 4 or more, but students are not be expected to factorise these
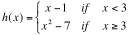
- simple piecewise
- exponential including the use of base e
- logarithmic y = loge(x) or y = logb(x)
- rectangular hyperbola y=1/x
- square root, f(x) = √ x
- absolute value, y = |x|
- Trig functions include sine, cosine and tangent with x in degrees or radians.
- Makes connections between representations, such as f(x) notation, tables, mapping, equations, words and graphs:
- Writes equations for graphs and vice versa.
- Explains effect on graph / equation of changing parameters.
- Understands effect of transformations in different representations.
- Demonstrates understanding of properties of functions, that is, one-to-one and many-to-one, and examples of relations that are not functions (for example, a circle).
- Understands the relationship between the graph of y = f(x) and the graphs of its transformations.
- Identifies and uses appropriate key features, that is, symmetry, period, amplitude, intercepts, maxima, minima, asymptotes, domain, and range.
- Makes links with solving equations
M7-7, manipulating expressions
M7-6, and gradient functions
M7-9.
- NOTE: Set notation is not expected. The emphasis is on understanding the ideas of function (as a connection between inputs and outputs in various forms) not on set theoretic notation, so students being able to state the domain and range in any form is sufficient.
Progression
M7-2 links from
NA6-7,
GM6-8,
GM6-9, and to
M8-2.
TOP
Possible context elaborations
- f(x) is shown below. Sketch f(x+2)
If you cannot view or read this graph,
open this text version.
- Identify key features of the graphs of the following functions:
- y = - x2( x + 1 )
- f(x) = 3sin(x) + 1, 0 ≤ x ≤ 360
-
M72
- The graph of f(x) is shown below. Write the equation of f(x).
If you cannot view or read this graph,
open this text version.
-
Activity: Coffee costs
-
Activity: Cool coffee
-
Activity: Skid marks
-
Graph transformations: A number of starter activities for graphs.
-
Investigating algebra: Explores graph shapes.
-
Paper folding: Introduction to exponential functions.
-
Rental car rates: Investigating rental car rates.
- Conversions: Investigate conversion graphs. For example: pounds to kilos, miles to km, ounces to grams, mph to kmph, inches to cm, $NZ to $AUS,… Write equations from the graphs, and/or draw graphs from the equations. Find values for specific points.
- Service costs: Investigate service costs. For example: electricity, phone, gas, postage, etc. Are they linear relationships? What is the gradient and what does this represent? Is there a cost if none is used? Where is this on the graph?
- Weight for height: investigate weight for height charts.
- Car running costs: Compare the costs of running a car using different types of petrol, CNG and LPG.
- Car vs bicycle: A car and a bicycle are travelling along a straight road. Both have constant speeds, although the car is moving more quickly than the cyclist. Draw a distance time graph for the car and bicycle to show before, during and after the car overtakes the bicycle. Include reasonable units on your axes, and find the exact time and place when the overtaking occurred.
- Stopping distances: Look at the stopping distances and reaction time involved in the braking of a car, motorcycle, bicycle, truck etc.
- Tortoise and the hare: Sketch the distance time graph for the story of the tortoise and the hare. Write at least four sentences describing important features of the graph.
- Estate agents: Investigate the charging systems of estate agents.
Assessment for qualifications
NCEA achievement standards at level 1, 2 and 3 have been aligned to the New Zealand Curriculum. Please ensure that you are using the correct version of the standards by going to the
NZQA website.
The following achievement standard(s) could assess learning outcomes from this AO:
Last updated September 17, 2018
TOP

