Venn diagrams
Teacher notes
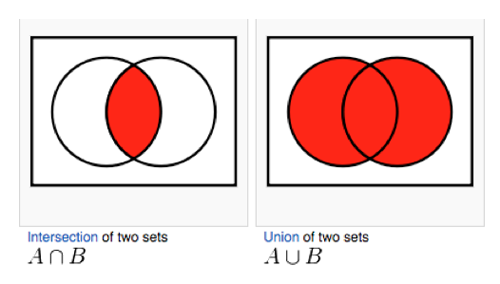
Venn diagrams use overlapping circles to demonstrate the concepts of union and intersection of sets very clearly, which makes them a useful teaching tool.

The shapes don’t have to be circles. Venn diagrams are also a useful tool for problem-solving, and enabling people to visualise conceptual structures behind issues they need to deal with.
Two-way Venn diagrams are not an efficient method of problem-solving. Two-way tables offer a more effective method of solving any problem which might be solved using two-way Venn diagrams. One reason for this is that two-way tables represent the different numbers or probabilities involved more clearly than Venn diagrams, aiding understanding as they can have the totals in the marginal rows and columns.
An example from an NCEA exam:
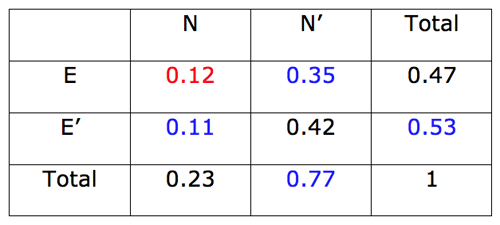
Nichole plays a lot of Scrabble. She believes that 47% of the words she spells use the letter E and 23% use the letter N, and that 42% of the words she spells have neither an E nor an N.
- Based on Nichole’s beliefs, calculate the proportion of words spelt by Nichole that have both an E and an N.
- Determine the proportion of words that Nichole will spell that have an N given that she has used an E.
When solving this problem using a Venn diagram, there is nothing to help the student fill in the empty spaces in the circles except their own understanding of probability.

Solving the same problem using a two-way table, there are immediately places to put every number, and the rest of the spaces can be filled in using arithmetic:

The solutions to the questions can then be easily read off the table.
- P(E ∩ N) = 0.12
- P(N | E) = 0.12/0.47 = 0.2553
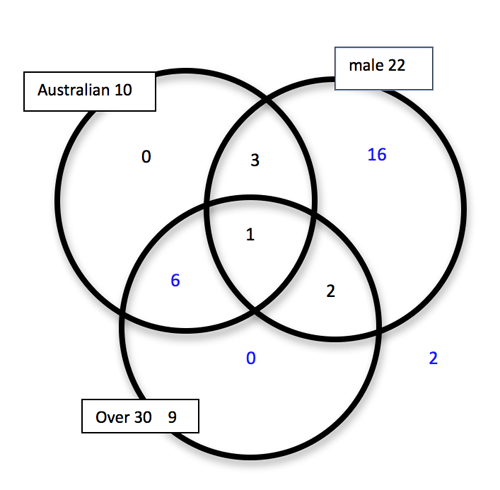
Three-way Venn diagrams can be useful problem solving tools, as they enable sorting among 3 over-lapping categories in a way that neither tables nor trees can do.
A (corrected) example from an NCEA exam:
From the tour company’s records for a randomly selected day, the following information was found:
- 22 passengers were male
- 10 passengers were Australian
- 9 passengers were aged over 30
- 1 passenger was a male Australian aged over 30
- 3 passengers were male Australians aged 30 or younger
- There were no female Australians aged 30 or younger
- 2 passengers were males aged over 30, but were not Australian
- There were 30 passengers altogether.
Find the probability that a randomly selected passenger for that day was a female Australian aged over 30.
The solution can be worked out by putting the given information into a Venn diagram and using arithmetic.
- P(female ∩ Australian ∩ over 30) = 6/30

Last updated September 25, 2013
TOP


