Level 8 learning experiences
M8-1
- M8-1 Apply the geometry of conic sections.
Goat on a loop |
Ice cream cones |
Investigation conic sections
Goat on a loop
A goat is tied to two poles as shown by a loop of chain.
Find the shape of the outline the goat may form when grazing.
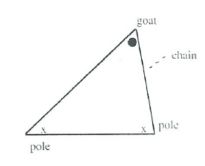
Goat on a loop_1
Students can investigate variations of this situation also.
Extension
Find the shape of the outline the goat may form when grazing if there are three poles in different configurations.

Goat on a loop_2
Investigate using four poles.
Ice cream cones
Students work in pairs to create various shapes by cutting plasticine or play dough or carrot with a sharp scalpel or string.

Cones
A record of the shapes produced can be formed by drawing around the shapes produced.
A good starter activity.
Investigating conic sections
Reference
Australian Academy of Science. Mathematics at work: Modelling your world volume 2.
- Students investigate conics, including foci, by making them:
- Students investigate conics through curve stitching (drawing):
- Parabola
- Ellipse
- Hyperbola.
- Students investigate hyperbolas through drawing
All activities allow students to investigate the conics with directed activities and expose students to terminology associated with conics.
Some activities pose “what if” questions, for example, Ellipse page 17, Hyperbolas page 19.
TOP
M8-2
- M8-2 Investigate families of function and their inverses making connection between transformations of a graph and changes to the equation of the graph.
M8-3
- M8-3 Uses permutations and combinations.
Anno’s three little pigs │
Ants │
Expand it │
Power factor investigation
Anno’s three little pigs
Borrow the book ‘Anno’s Three Little Pigs’ by Mitsumasa Anno and Tuyosi Mori. This book has an alternative title of ‘Socrates and the Three Little Pigs’.
The whole book is a lovely story; but to introduce arrangements and selections read to the class pages 2, 3, 4, 5, last sentence of page 13, 14 to 28, the last paragraph of pages 39, 40, 41.
Ants
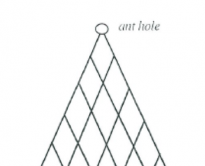
Ant hole
Ants emerge from the hole at the top of a piece of trellis. They always walk downwards, never upwards along the trellis.
Investigate the paths they may take to any particular intersection on the trellis.
- How many different paths are there to particular points?
- Write the number of paths to each point immediately below the point on the grid.
- Select a given level. Are some points more likely to be reached than others?
- Is there a pattern? Describe the pattern.
Expand it!
- Ask students to expand the following:
- (x + y)
- (x + y)1
- (x + y)2
- (x + y)3
- Draw Pascal’s triangle on the board.
In groups of 2 or 3 students discuss any relationship between Pascal’s triangle and the expansion of the above problems. Do not help them. Allow your students to investigate for themselves any patterns or discoveries they may find.
- Ask someone in the group to report on their findings.
- Using what you discovered in groups, can we now find the expansion of (x + y)4 without using repeated multiplication?
- Is it possible to generalise? How can we expand (x + y)n, for n, a positive integer?
Power factor investigation
- How many positive integers will divide evenly into:
Hint: It may be useful to break up the problem into bits, that is:
- how many positive integers will divide into 24 ?
- how many positive integers will divide into 24 x 32 ?
- how many positive integers will divide into 24 x 32 x 53 ?
- Find a formula to find the number of factors of:
- an x bm x cp where m, n, p Î I
- and a, b, c are prime numbers
Hint: It may be useful to use nCr notation in your formula.
- Does the formula still hold if one or more of a, b and c are not prime? Use examples or another method to help justify your answer.
TOP
- M 8-4 Use curve fitting, log modelling, and linear programming techniques.
Ball bouncing │
Modelling the population
Ball bouncing
Henry believes that the maximum height of the first bounce of a ball is always
 of the height the ball was dropped from.
- In groups of three you are to investigate Henry’s conjecture.
- You need to collect data to help decide whether or not Henry is correct. You should display the data in an appropriate way. If your data does not support Henry’s conjecture you are to decide on a more appropriate conjecture that relates the height of the first bounce to the original (dropping) height of the ball. Write your conjecture as a sentence and as an algebraic formula.
- Show all your reasoning, graphs and conclusions in the final report.
- Include a discussion on the size and reasons for any inaccuracies of your result.
Equipment needed
- A bouncing ball for each group (tennis balls, etc)
- Measuring equipment (metre rules)
- A graph board may be useful to record the height of the bounce against.
Modelling the population
(Using log/log, semilog, or ordinary paper to investigate real data) – computer.
-
Students investigate the question:
“What will be the New Zealand population of .............. in 2050?”
- The teacher can choose either a declining population (e.g. population of Kiwis) or an increasing population (e.g. AIDS victims) for the students to investigate.
- Collect the data from an appropriate source before the lesson, for example:
- AIDS numbers from Notifiable Diseases Clinic
- New Zealand Year Books
- Department of Statistics
- PC info
- data bundle.
- Data at 5 or 10 year intervals is useful.
- Students analyse the data to find the most reasonable model for it. Use Excel spreadsheet or other to plot on computer. They use appropriate scales and plot data on ordinary graph paper, log – log and/or semilog paper to find the best model for the data. They should use this model to predict the population in 2050.
- Students can discuss any known factors that may have had an effect on the population or make suggestions of possible factors.
- Students could use moving averages to smooth the data and use this to predict the population value for 2050. They can compare this with the prediction made using their best model.
TOP
- M8-5 Develop network diagrams to find optimal solutions, including critical paths.
- M8-6 Manipulate trigonometric expressions.
- M8-7 Form and use trigonometric, polynomial, and other non-linear equations.
Graphing projectile paths |
Investigating algebra |
Practical situations - trigonometric graphs |
Tidal estuaries
Graphing projectile paths
Reference
Mathematics at work: Modelling your world volume 2
- Students investigate the parabola as a path of objects in motion (page 20)
- Students graph projectile paths using parametric equations. This investigation should involve spreadsheets and graphing.
Better to show on a projector e.g. photo of water in a fountain …………
Investigating algebra
A maths teacher claims that the most important feature in a piece of algebra is the highest power of x in it, as it determines the nature (or shape) of the relationship involved.
Task
- Investigate this claim by point plotting various powers of x. Include whole numbers, integer and fractional indices but keep the piece of algebra in the form y = xa.
- Consider alternative algebraic forms like y = 2x, y = log x, y = 3√x and xy = 1 in your investigation, highlighting pairs of inverse functions where you discover them.
- Write a report detailing your findings, either supporting or refuting the claim of the maths teacher.
Practical situations involving trigonometric graphs
Investigate the pedal height vs time with a bicycle.
Note it may be best to take height measurements against horizontal distance (as this will be related to time).
- Investigate the height of a loaded oscillating spring above the ground (vary the loads on the spring).
- Investigate the height of the waves at the end of a wharf vs time.
- Investigate the height of water at the end of a wharf. High and low tide times can be obtained from the paper.
Trigonometric graphs can be drawn from the information and the trigonometric equations can be established. Terms such as amplitude, period, frequency can be discussed.
Note: Could give students data to pull out information.
Tidal estuaries
Investigate the times that yachts can enter or leave tidal estuaries, for example, Havelock in the Sounds, Mana.
Students should plot height vs time for the situation.
Variables include size of yacht (that is, depth it draws), high and low tides, and depth of water.
This investigation is a localised one and perhaps could be done as an investigation outside the classroom.
TOP
- M8-8 Form and use systems of simultaneous equations, including three linear equations and three variables, and interpret the solutions in context.
- M8-9 Manipulate complex numbers and present them graphically.
Complex numbers investigation |
Complex numbers matching activity
Complex numbers investigation
- Copy this diagram neatly onto your sheet and label the axes correctly.
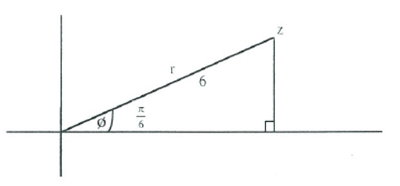
Complex numbers investigation
- If z = a + ib, use the diagram to help you calculate the values of a and b. Show your working.
- Draw another argand diagram with some complex number z plotted in the first quadrant. Label r and ø. Do not assign values to r and ø.
- z = a + ib
- Write a in terms of r and ø.
- Write b in terms of r and ø.
- Hence write an expression for z in terms of r and ø.
- In groups or as a whole class use factorising/ lateral thinking/ inspiration/ bolt of lightning to explain what z = cis ø means!
Hints
- Cis 3∏ is the same as 1 cis 3∏
- Sketch the complex number on an argand diagram before attempting calculations. Sometimes the answer is obvious.
Complex numbers matching activity
Teacher instructions
- This activity is useful as a review or revision task after the topic has been completed.
- Photocopy the table below. Have one for each student if students are to work individually. However this activity works well when done in pairs or groups of three. Each group needs only one copy of the sheet.
- Each group needs a pair of scissors and glue or Sellotape.
- Students cut up the sheet along the lines. They are to pair the pieces together correctly and glue them onto an answer sheet or into one of their books.
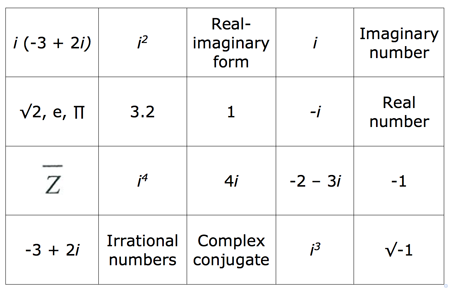
Complex numbers matching activity
TOP
M8-10
- M8-10 Identify discontinuities and limits of functions.
Graf it
Discuss and identify aspects of graphs, for example, discontinuities, asymptotes, limits, gradients.
- Investigate the graph of:

- Investigate the graph of:

- Create your own function which has a quadratic and a linear as numerator and denominator respectively. Predict the function’s shape and location. Investigate the graph of your function.
Teacher notes
These investigations of graphs not familiar to the students are useful to discuss and revise the method of point plotting (prior to investigation of graphs within the curriculum). It also provides an excellent introduction to the discussion (and formal definition) of limits.
Use graphics calculator, or graphics programme on computer.
TOP
M8-11
- M8-11 Choose and apply a variety of differentiation, integration, and anti-differentiation techniques to functions and relations, using both analytical and numerical methods.
Area under a curve investigation |
Cyclist’s knees |
Design a race track |
Design a race track 2 |
Maximum areas |
Measuring volume of water |
Rugby anyone?
Area under a curve investigation
Students investigate the area under a curve (e.g. y = x2) between certain x values.
By drawing the graph and using spreadsheets, students should be able to develop different models and establish the most accurate procedures for obtaining area under a curve.
Note
- Students should establish that by increasing the number of intervals, accuracy improves.
- Students will probably start with rectangles (maximum and minimum areas) and move onto mid-ordinate rule and trapezium rule.
- Simpson’s rule can be developed from this.
Cyclist’s knees
Investigate the movement of cyclist’s knees. At which points are they moving fastest/slowest? Sketch a graph to represent the situation (e.g. speed of knee vs height). Discuss the gradient of the graph at different positions. Sketch a graph of the gradient function.
Design a race track
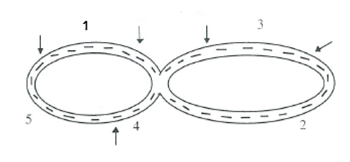
Race track
This activity involves students simulating a car race.
Initially keep it simple. A figure 8 type track is fine with curves and straights. Be more creative and complex later.
Draw a race track. Mark on your race track 5 different sections. Label each section 1-5. The sections need not be uniform and may be as long or short as you desire. Use section 1 as your start / finish place and we will try and simulate a car race.
We need to make the assumption that the total distance around the track is fixed, and for the purpose of this exercise let’s make this distance 4.5 km for everyone.
In every section of the track mark the distance of the section. The distances can all be different as long as the total circuit adds to 4.5 km.
Using a pair of die as your speed control, throw the dice and multiply the sum of the pair of die by a factor of 20km/hr i.e. throwing a 2 the car travels at 40km/hr, throwing a 12 the car gets to a top speed of 240 km/hr. Throw the dice once for each section of the track.
Find and record the speed of your car for each section of the track, and display this on a velocity / time graph.
Remember:

If you also place restrictions on how fast you may travel on certain parts of your track, (for example, slow down at corners) this will affect the shape of your graph.
There will be some graphs which cannot possibly be correct. How does your sketch of the race track determine this? Explain whether or not your graph of velocity/time is realistic for your race track.
This starter could lead to discussions on rates of change, curve sketching and forming a differential equation model of a simulated situation and then use it to interpret and draw conclusions about the situation.
Design a race track 2
- A: In this activity, students are given some distance time graphs for different race tracks. For each graph they must sketch the corresponding velocity time graph. They can also sketch a realistic race track for each distance time graph.

Race track_graphs1
- B: In this activity students are given velocity time graphs for different race tracks. For each velocity time graph they must sketch a realistic race track.

Race track_graphs2
Extension
For each of A and B students can draw their own graphs to swap with another group.
Maximum areas
Give students several pieces of rectangular paper (for example, 5cm x 10cm). The dimensions are not too important as long as all the pieces are the same size. Ask students to draw different shapes such as circles, ellipses, squares etc. (one shape on each piece of paper).
The shapes must be drawn so that they have the maximum possible area. Students must calculate the areas of their shapes and compare their answers. (Using squared paper makes the calculation a little easier).
This type of 10 minutes activity leads nicely to the discussion of maximum and minimum type problems, given a certain constraint (in this case the dimensions of the paper used are the constraint).
Discussion questions
- Which shape drawn has the largest possible area?
- If the dimensions of the paper were changed, how would that affect the maximum size of a particular shape?
- What would happen if you change the shape of your drawing paper from rectangular to circular?
Extension: Maximum volumes

Max volume
An extension is to consider maximum volumes. You are given the task of designing an African hut. It must have a cylindrical base, with a conical roof.
Again, using a fixed area of paper, design and make a model of the hut so that it has maximum volume. Suggest several pieces of paper for each person/group.
Measuring the volume of water
This activity can be done in two ways:
A: Practical field work involving an afternoon.
- Using a suitable river, for example, Hutt River, measure the depth of the river at regular intervals across the width of the river
- Establish the cross sectional area of the river using a numerical integration technique.
- Measure the speed of the water (for example, the time it takes for a submerged object to travel a distance).
- Estimate the flow of the river.
B: Provide the above measurements for students to use.
This investigation could be carried out at various parts of the river but take adequate safety precautions! (EOTC).
Rugby anyone?
Determine an equation for the profile of a rugby ball and use integration techniques to calculate the volume of revolution.
The rugby ball is an ellipsoid.
The activity could be repeated for:
- Other balls, for example, table tennis ball, soccer ball, American football etc.
- Fruit of different shapes, for example, grapefruit, orange, melon, tamarillo etc.
TOP
M8-12
- M8-12 Form differential equations and interpret the solutions.
Are they thick and fast? |
Don’t drink the water
Are they thick and fast?
Measuring the flow of students to your class:
Here is a simple, practical problem in which students must first design a method to measure the flow of students who arrive to a particular class. Students may come up with a variety of answers and no one particular solution may be correct. They must determine what the appropriate variables are and how they would sketch the graph of this flow.
What factors determine the rate of flow?
This could lead to forming a differential equation model of a practical situation and using it to interpret and draw conclusions about the situation.
Don’t drink the water
Working in groups, students investigate and report on practical problems involving rates of change. For example, a lake contains 106 litres of water, and a factory begins dumping a chemical at the rate of 1 litre per hour. The lake is fed by a fresh stream at 39 litres per hour and keeps a constant level. If the chemical level reaches 0.1%, then the lake is too polluted for drinking.
Students investigate pollution levels of the lake under given conditions.
The investigation could be extended by altering the conditions or better, by using some realistic data from a lake or river near your school.
TOP
S8-1
- S8-1 Carry out investigations of phenomena, using the statistical inquiry cycle:
- A – conducting experiments using experimental design principles, conducting surveys, and using existing data sets
- B – finding, using, and assessing appropriate models (including linear regression for bivariate data and additive models for time-series data), seeking explanations, and making predictions
- C – using informed contextual knowledge, exploratory data analysis, and statistical inference
- D – communicating findings and evaluating all stages of the cycle.
S8-2
- S8-2 Make inferences from surveys and experiments:
- A – determining estimates and confidence intervals for means, proportions, and differences, recognising the relevance of the central limit theorem
- B – using methods such as resampling or randomisation to assess the strength of evidence.
S8-3
- S8-3 Evaluate a wide range of statistically based reports, including surveys and polls, experiments, and observational studies:
- A – critiquing causal-relationship claims
- B – interpreting margins of error.
Another political opinion poll
Resources
Results of latest Heylen or other poll.
Task
- Discuss with your class the results of the poll and explain the concept of margin of error.
- Generalise the results to an election happening tomorrow.
- Students write a 250 word newspaper article.
- Discuss sampling methods used and the problems of meaning and value of such polls.
Note: Heylen tend to use a phone survey and add 1 to each number chosen to guarantee anonymity.
TOP
S8-4
- S8-4 Investigate situations that involve elements of chance: A – calculating probabilities of independent, combined, and conditional events
- B – calculating and interpreting expected values and standard deviations of discrete random variables
- C – applying distributions such as the Poisson, binomial, and normal.
A normal search |
Yummy experiment |
Am I right? |
Games involving probability |
Have a guess! |
Mix or match |
Raisin buns |
Toss it – It’s a dicey one
A normal search
This is a useful homework activity as a lead in to work on the normal distribution.
Students try to find a population that shows a normal distribution, collect data from it and analyse the data to see how close to a normal distribution their population is.
A five or ten minute discussion in class is needed to explain what they must do and to brainstorm ideas of places to look for normal distributions.
Some likely normal distribution experiments:
- Weights of lemons from a tree
- Lengths or widths of leaves from a tree
- Mass of worms from a compost heap
- Mass of grapes in a bunch
- Heights of year 13 students etc.
Students must:
- Decide on a population to test size
- Collect a sample of 100
- Calculate the mean and standard deviation for their data
- Count how many of their sample lie within one standard deviation of the mean (compare with 68%) from a true normal distribution.
- Count how many of their sample lie within two standard deviations of the mean (compare with 95%) from a true normal distribution.
- Plot their data to compare the shape with a bell curve.
- Write a summary to explain how close their population is to a normal distribution based on the data from their sample.
Follow up activities could include whole class discussion, reducing their own distribution to a standard normal distribution, discussion of sampling methods, discussion of comparison of sample and population values of the mean and standard deviation etc.
A yummy experiment
A Poisson distribution investigation
Equipment needed
A large block of hokey pokey ice cream
Paper plates
Plastic teaspoons
A large knife
- The teacher explains that the class is to do an experiment to investigate the Poisson distribution.
- Students will each get an equal sized cube/rectangle of hokey pokey ice cream. The distribution of interest is how many pieces of hokey pokey are within the equal sized pieces.
- The ice cream is cut into equal sized pieces. Each student has one piece.
- To find how many bits of hokey pokey are in their cube of ice cream, students will have to eat it (slowly enough to be able to count the bits!).
- The class records the distribution of how many pieces of hokey pokey and the frequencies.

Hokey pokey
- Students use the data to calculate the mean and standard deviation of the distribution.
Am I right?
Multi-choice test as an introduction to the Binomial Distribution.
Students are asked to complete the answers for a multi choice test. There are 20 questions, each question has 4 possible answers A, B, C and D. They have to guess the answers.
Before marking ask them to estimate the most common mark and the mean.
Mark the questions by using a random process for allocating to A, B, C and D (equally likely).
After marking collect the marks, form a frequency distribution and calculate the mean and standard deviation.
This gives a very good lead in to the binomial distribution and is worth referring back to as theoretical ideas are introduced. It may be useful to conduct a similar test with 5 possible answers A, B, C, D and E.
A variation on this is to conduct an Extra Sensory Perception Experiment (ESP). Suits of playing cards could be used, but in ESP experiments Zener cards are used with five symbols; rectangle, circle, cross, star and wavy lines.
Both the multichoice test and the ESP activity can be investigated through simulation.
Games involving probability
Craps
The shooter (person with the dice) rolls the two dice.
Bets win if on the first roll (known as the Come Out Roll), a total of 7 or 11 is thrown. Bets lose or “crap out” if 2, 3 or 12 is thrown.
Any other numbers (i.e. 4, 5, 6, 8, 9 or 10) becomes known as the point. If the point is thrown again, before a 7 is thrown, you win.
Bets lose if the 7 is thrown before the point.
Two up
The game is played with two coins spun in the air by a volunteer “Spinner”. The spinner spins for pairs of Heads or Tails in sets of three consecutive results. When the coins show odds all bets stay until the next result.
Bets are on Head, Tails or Five consecutive odds.
All bets on Heads or Tails lose when five consecutive odds are thrown. And when a pair of Heads or Tails come up the bets on five consecutive odds lose.
The winning odds on Two up are:
- Heads Even money
- Tails Even money
- Five Consecutive Odds 27/1
Two up terms:
- Heads: Both coins showing Heads
- Tails: Both coins showing tails
- Odds: One coin showing Heads, the other Tails
Investigate the probabilities involved in the above two games.
What is the expected gain for the player in the game of Craps?
What is the expected gain for the player betting on Heads? Tails? Or Five Consecutive Odds? In Two Up?
Have a guess!!
A Binomial distribution experiment
Student worksheet
You may work in pairs to collect your data but must hand in one experimental report each.
- Try out the sseven question quiz on students.
THE QUIZ
For each statement choose true or false. Please do not discuss the questions.
- When exposed to a wind of 30 miles per hour in a temperature of -30˚F, human flesh freezes solid in 30 seconds.
- A coho is a fish.
- Omdurman is a town in Morocco.
- The probability of getting a royal flush in poker is about 1 in 650,000hands.
- A brool is a deep murmur.
- Before anaesthetics were invented, the shortest time recorded for a leg amputation was 20 seconds by napoleon’s chief surgeon, Dominic Larrey.
- The fonticulus is a little dip just on top of the breast bone.
Collect a minimum of 50 sets of results. Tabulate the results.

Results
Finding a probability model
Since it is unlikely that the answers will be know, we expect each student to guess correctly with a probability of ½ for each question.

Probability model
For three questions:
We would expect 1/8 of the students to correctly guess the answer to all three questions.
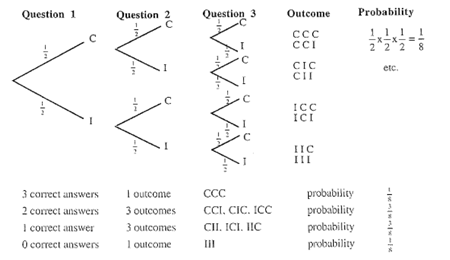
Three questions
If we consider more than three questions, it becomes difficult to draw a tree diagram, but a table is useful:
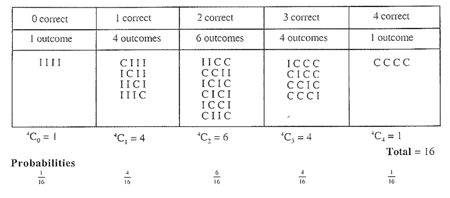
Have a guess_Table
-
Draw up a probability model for seven questions:
Probability model for 7 questions
- Use this model to work out the expected frequencies for your experiment. (that is, multiply each theoretical probability by the total number you sampled).
- Show both of these sets of results on bar graphs (that is, your experimental frequencies and your actual frequencies).
-
Work out the mean and variance of these two distributions using the formulae:

- Find (i) np and (ii) npq and comment on these results.
- Does the world’s most famous bell, Big Ben in the clock of the House of Commons in London have a mass of A: 12.575 tons, B: 0.05 tons, C: 13.575 tons or D: 14.25 tons. There are four alternative answers and only one is correct; so the probability of guessing a correct answer is 1/4. For a series of 5 questions of this type form a probability model. (i.e. for 0, 1, 2, 3, 4, 5 correct answers using p = ¼, q = ¾ )
Mix or match
The situations
Different numbers of beans of two colours are put into the hand and enough are removed to leave two beans in the hand. What is the probability of a mix or a match?
Materials required
Beans, counters or blocks of two colours.
Student tasks
- Take 3 beans: 2 of one colour and 1 of a second colour (say 2 red and 1 white)
- Shake the beans in your hand (or a cup)
- Take out one bean and put it aside.
- Look at the remaining 2 beans.
- Record if they are different or the same – a mix or a match.
- If you were to do this experiment several times, which would you predict would occur more often: a mix or a match?
- What do you think P (mix) = ? P (match) = ?
- Do the experiment 6 times.
- Record your results.
- Are you surprised?
Teacher
-
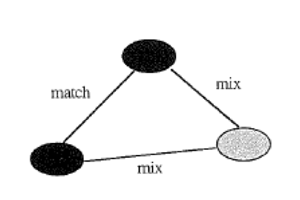
Mix and match
Go through the theoretical situation.
The diagram to the right illustrates the possible results. There are two ways for a mix and one for a match. In the long run, we would expect twice as many mixes as matches.
Student tasks
- Add a red bean to your collection. Now you should have 3 red beans and 1 white bean.
- Shake the beans and remove 2 beans.
- Look at the remaining two beans.
- Do you predict more mixes or matches?
- Try this experiment 6 times.
- Record your results.
- Draw a diagram to illustrate the possible results.
- What is P (mix) = ? P (match) = ?
- Add another red bean.
- Shake the beans and remove 3 beans
- Look at the remaining two beans
- Repeat this experiment 6 times recording your results.
- Draw a diagram to illustrate the possible results.
- What is P (mix) = ? P (match) = ?
- Repeat above procedure for 5 red beans and 1 white bean
Teacher
- Get the students to record the results for the number of red beans, the number of mixes and matches in a table like the one below. They should be able to generate the pattern to find the general rule for the number of mixes and the number of matches for any n red beans.
NB: the table contains the answers.

Mix or match_table
Student tasks
- Use a table to record the results.
- What if there were 10 red beans? n red beans?
- Find the P(mix) and P(match) for n red beans?
Raisin buns
An approach to introducing the Poisson distribution
- A baker needs to make 100 buns but only has 150 raisins.
- What is the probability that a bun has no raisins?
- What is the greatest number of raisins that will be found in a bun?
- How can we find the answer to a question of this type?
- Find the answers by performing a simulation.
- Set up an array as shown representing raisin buns numbered 00 to 99.
Use 150 two digit random numbers.
As each number is taken put a tally in the corresponding cell to the array.
This represents putting a raisin in that bun.
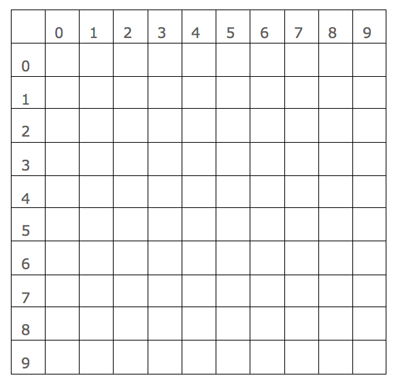
Raisin buns_array
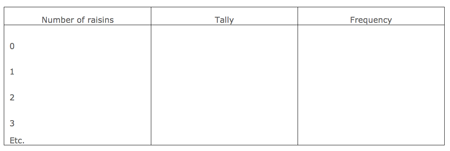
Complete the following frequency table:
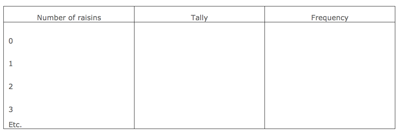
Frequency table.
Calculate the mean and the variance of the frequency distribution.
Get groups of students to display their frequency distribution and the mean and variance.
Compare the relative frequencies obtained with the theoretical probabilities for the Poisson distribution from tables (using λ = 1.5).
Note the fact that the mean is approximately equal to the variance, and introduce key ideas of the Poisson distribution.
Toss it – It’s a dicey one
You have been given the job of running a games evening to help raise funds for your cricket team’s trip to Australia. To encourage people to come and play you have decided to invent some exciting new games that either use coins or dice. However you want to make sure that they will earn you a reasonable amount of money as well as making punters feel they have a good chance of winning.
Task
You are to invent a dice or coin game that will use at least 3 coins or 2 dice or a mixture of both coins and dice.
For your game you must work out:
- How much you will charge to play each game
- How a punter will win and how much they will win when they win
- A punter’s probability of winning
- A punter’s expected return for every dollar bet
To ensure you have calculated things correctly your team manager wants to see a report outlining the game. As she is also a maths teacher she also expects to see appropriate maths in the report – like probability trees, probability distributions and expected values.
Last updated September 9, 2018
TOP


