Level 6 learning experiences
NA6-1
Investigating GST
Fill in the following table.
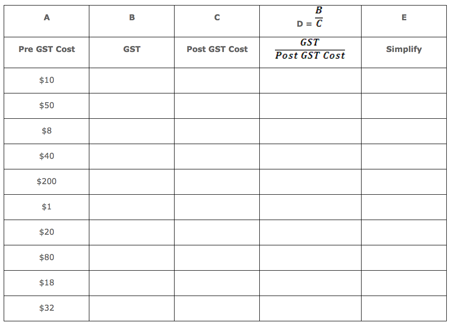
Investigating GST_table
In an organised way show a method for finding the pre GST price of an item. Try your method for the POST GST prices of $81 and $21.25. Can you find a simpler way?
TOP
NA6-3
Savings plan
Two boys aged 10 and 12 are employed to mow lawns on a weekly basis. They are paid their age, i.e. the 10 year old gets $10 per week and his 12 year old brother gets $12 per week. This pay increases with their age.
The boys’ parents encourage good ‘savings’ habits, by placing $250 into the boys savings accounts for every $500 that they have saved themselves. The boys each decide to split their money in the following way.
 is placed into a savings account, approximately a
 of what remains goes into a toy account, the rest may be spent on a “good time”.
The toy and ‘good time’ money may be placed in their savings account if they wish.
Students decide how to spend the toy and good time money.
You have a goal to save up for something special. It may be anything you like, your first car, trip to the islands for a holiday, ipod, ipad, be imaginative.
Your answers should include:
- Tables and graphs showing amounts of money earned and spent.
- Any relationship or rule generated by your tables and graphs.
- A line plan on saving for your ‘dream goal’.
- Design a balanced savings plan, which allows you to save money, buy toys, and also enjoy the money and a good time. A plan which allows you to achieve your ‘dream goal’!
TOP
NA6-7
The fence │
Matchsticks │
Number pattern investigations │
Sprints
The fence
A boundary fence has 100mm by 100mm posts evenly placed at almost 4m apart.
- How many posts will be needed for a fence:
- For each fence in (1), how far apart will these posts be placed?
The design of the fence is as follows:
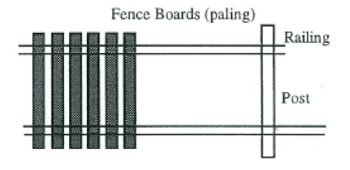
Fence
- If each board is 2m tall, in a 1:50 scale drawing how long would the board be?
- Each board is also 22cm wide (and has a gap between it and the next board of 3cm). How wide should the board be on the scale drawing?
- Create a 1:50 scale drawing for the piece of fence shown above.
- Create a set of equations which will tell you the number of posts, railings and boards you will need for a fence n metres long. Invent notation of your own to cope with the problem of having to round calculation answers.
- If a post costs $10.50, a railing $13.00 and a board $7.30, use your equations to calculate the cost of an 18m fence.
Teacher notes
This problem will need follow-up discussion on things like:
a) Drawing a sketch as a problem solving strategy to ensure correct number of posts are placed.
b) Methods of ensuring posts are equally spaced apart.
c) What to do when your maths says a fence board is 4.4m wide on a scale drawing.
d) How to deal with rounding in functions.
Matchsticks
Task
- To design a series of matchstick patterns.
- To find a relationship between number of matches and the pattern.
Resource
Plenty of matches.
Design a series of matchstick problems (the 2D designs with extensions to 3D patterns).
Here are a few patterns:
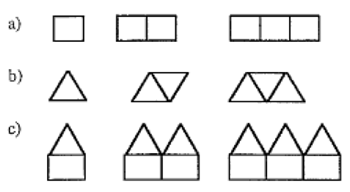
Matchsticks.
There are standard questions which may be asked and adapted.
- Draw a table showing relationship between number of shapes and number of matches. For example:
-
Number of squares 1 2 3 4
Number of matches 4 7 10 -
- Find a rule (Use your own symbols).
- How many matches would it take to make pattern 10?, 100?
- Which number of shapes uses 61 matches?
- Draw a graph of the relationship.
- Try a reverse type problem, that is, given a relationship, draw the pattern. For example, What would a relationship like pattern = 7 x Number of matches + 1 look like?
- Draw three-dimensional problems and find the appropriate relationship.
Number pattern investigations
- Investigate the relationship between the number of people in a group and the number of handshakes required for everyone to shake hands with each other person in the group once only.
- A sporting competition requires that each team plays against every other team twice. Investigate the number of matches in the competition for different numbers of teams. Try to find a formula that links the number of teams to the number of matches.
- Find a relationship between the number of straight cuts across a pizza and the maximum number of pieces that can be made by the cuts.
-
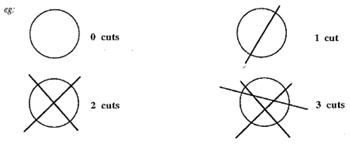
Number pattern investigations
Repeat the investigation for a cube of cheese.
Investigate how many different sums can be used to make the number 15:
Rules:
- 1. Whole numbers only may be used.
- 2. Zero may not be used.
- 3. Reversing digits is allowed – that is, 7 + 8 and 8 + 7 can both be counted.
Try to find a general rule, that is: How many different sums can be used to make the number ‘n’.
- Create or find your own dot problem, or use one of the ones below. Determine the relationship between the number of dots in the base and the total number of dots.
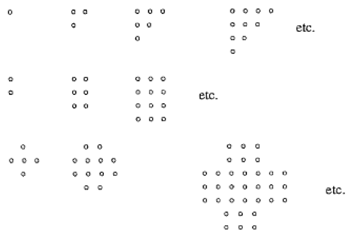
Number pattern investigations_dot problem
Sprints
SBW, Richard and Cory are all practising for the 100m sprint from try line to try line. SBW can run 100m in 13.5 seconds, Richard can do it in 12.8 and Cory in 14.2 seconds.
- Draw a graph to show these players’ progress over the 100m if they all start together
-
The coach suggests a handicap system so that they all finish at the same time. They decide to use a time handicap.
Draw a graph of this and use it to calculate the time handicap for each person.
-
Richard decides he would rather have SBW and Cory start further down the field.
Draw a graph of this and work out the distance handicaps that should be used.
- Which of these systems would be fairest to run a handicap race? Give reasons.
TOP
NA6-8
Graphing rates │
Matching graphs and situations, and using rates of change │
Slot cars
Graphing rates
The purpose of this activity is for you to:
- obtain measurements of rates from graphs
- communicate the rates information you have found by displaying it on a graph and by describing it in words.
What to do
- Use the following graphs to take accurate measurements of gradient for at least six time values for each graph. You will need to decide which time values are best to use in order to draw an accurate graph of rate of change vs time.
- Use the calculations of rate of change to plot the rate of change graph.
- Write a description of the situation that includes a comparison of rates at different times. i.e. that compares the rates of motion of the tortoise and the hare, and that compares the rate of change of oven temperature at different stages of heating.
- Sketch the shape of the graph that would be obtained if temperatures were measured as an oven cooled down after being switched off. Beside it sketch a graph of rate of change of temperature vs time with two explanatory sentences.
A: The race of the tortoise and the hare. Remember: the hare runs the first section of the race, sees how far behind the tortoise is and stops to have a rest. The rest becomes a sleep which it wakes up from just as the tortoise is approaching the finish line. The hare runs to catch up but the tortoise is victorious.

Graphing rates_tortoise and the hare
B: The temperature of an oven is measure as the oven heats up from room temperature to the set temperature of 150˚C. The results give the graph shown.
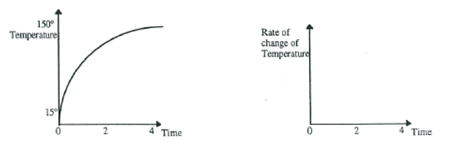
Graphing rates_temperature of an oven
Matching graphs and situations, and using rates of change
Match each situation (A – C) to a graph which illustrates the situation (a – c).
Justify why you have matched each situation to each graph.
Write a couple of sentences for each situation and graph pair explaining what is changing and how the rate of change varies.
Situations

Matching graphs and situations
Graphs of the situation

Graphs of the situation
Extension
Match the graphs showing rate of change (below) to the situations and graphs (above). Justify your answers.
Graphs showing rate of change

Rate of change
Slot cars
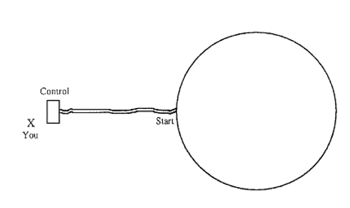
Slot car track
Your slot car goes clockwise around the track at a constant speed.
Graph the distance the car A is from you.
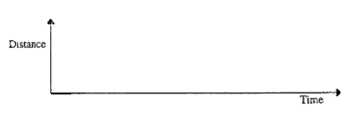
Graph the distance
- On the same diagram, draw the distance for car B.
- Describe what would happen if the cars went faster.
- Draw a graph of what would happen if the track had the same centre but a larger diameter.
Extension
Draw graphs for the following tracks.

Graphs for tracks
TOP
GM6-3
Storing petrol
Task
A garage owner has a truck which can carry 15.5 tonnes of petrol. He wants 3 storage tanks that will hold exactly one, two and three truck loads of petrol. Design the tanks.
Information you will find helpful
- The storage tank opposite is formed from a circular prism (cylinder) and circular pyramid (cone).
- 1 tonne of petrol has a volume of 0.70m3
-
Your answers should include:
a. All the calculations you made in completing the design.
b. A fully dimensioned diagram of each tank.
c. The calculated capacity of each tank
d. Reasons for rejection of a particular design.
TOP
GM6-5
The best buy
In the following, use your knowledge of the scale factor of enlargement to decide on the best buy.
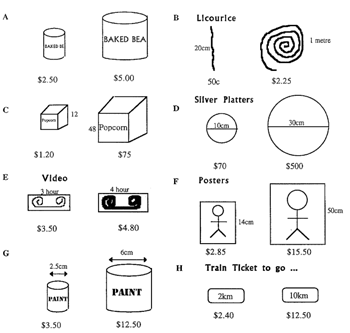
Best buy
TOP
GM6-6
Height of the school │
Making a box the shape of a pyramid
Height of the school
-
Use at least 3 methods to estimate the height of the main block of the school. Write up all 3 in the form of a wall display.
For each method:
a) Draw a diagram and use it to help explain how the method works.
b) Calculate limits of accuracy for each measurement hence calculate a range of results for your estimate.
Either:
By looking at the overlap of the 3 ranges establish the limits in which the actual height is likely to lie.
Or
Explain why your measurement results have no overlap and outline methods to improve the accuracy in future trials.
Making a box the shape of a pyramid
You need to make a box the shape of a pyramid.
Follow these instructions
- On a piece of cardboard, draw accurately a square with sides of 6 centimetres.
- Construct, using a compass, isosceles triangles on each side of the square with sides of 7 centimetres.
- Cut out using tabs.
Answer these questions
- Find the diagonal of the base (D).

- Find the angle (J) between L and D using trigonometry.
- Find the angle that the base of each of the isosceles triangles makes with the sides of your pyramid.
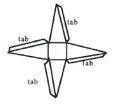
- Find the perpendicular height (P) of your pyramid.
- What is the volume of your pyramid?

Extension
Design a rectangular based pyramid with base 12cm by 10cm and side of triangle 9cm.
Construct the net but do not make up. Draw the 3-dimensional diagram of the finished pyramid.
Find the volume showing all working – step by step.
TOP
GM6-9
Frieze patterns
Choose a simple motif from the ones shown or make up your own.

Frieze patterns
- Use a combination of two of the following transformations on the motif to make a frieze pattern. Transformations you may use:
- Horizontal reflection
- Vertical reflection
- Translation
- Half turn
- Quarter turn
- Write a full description (using transformation terminology) of how another person could reproduce your motif.
- Investigate how many different friezes are possible using the two transformations you chose. Justify your answer.
TOP
S6-1
Appropriate graphing │
Arms and feet │
Big foot stands tall │
Bivariate investigations │
Comparing writing speeds │
Power jump
Appropriate statistical graphing
Task
Use appropriate methods to visually display the following information.
- Height vs arm span
- Transport to school
- Height of students in class
- Size of families
- Ethnic groups
The data can be quickly gathered and presented on the board.
Each group needs to present a bar graph, dot plot, scatter plot, box plot.
This is an appropriate starter on statistical graphs and should basically be a review of prior work.
Each student could do two graphs and then explain to other group members.
Arms and feet
- You are to design an investigation that will investigate the relationships between people’s foot length and the length of a person’s inside arm from their elbow to wrist.
- Carry out your investigation and write-up your findings using appropriate graphs and explanations of what they show.
Teacher notes
For most students a person’s foot length will fit almost exactly onto their inside arm. It can be fun getting them to do this.
Big foot stands tall
- Create a theory about the existence of a relationship between people’s height and foot length.
- Design an investigation to prove whether or not your theory is correct.
- Carry out your investigation and write up your findings using appropriate graphs and explanations of their significant features.
Bivariate investigations
Collect and graph data for one of the following situations:
1. Handspan vs finger length
Measure handspan (in mm) and length of little finger (in mm). Obtain measurements for at least 15 people. Plot data pairs on a set of axes and write two summary sentences about the results.
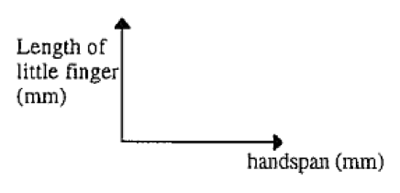
Handspan vs finger length
2. Speed of speech vs speed of writing
Time yourself to find:
a) How long it takes to count from one to twenty five.
b) How long it takes to write to fifteen as words (i.e. by writing “one, two, three, four…”).
Obtain data for a) and b) from at least 15 other people and plot all the data on one set of axes. Write two summary sentences about the results.
3. TV vs homework
Record for at least 15 people the number of hours or minutes they spent the day before watching television and how many they spent doing homework. Plot the data on a graph and write two sentences about the results.
4. Own survey
Make up your own survey which involves looking for a relationship between two factors. Collect data, plot data pairs and write some summary statements about it.
Comparing writing speeds
Are we quicker writing with our awkward hand or writing backwards.
Ask the students which they think that we are quicker at, record the vote, and then ask them how we can find out.
Hopefully they will suggest that we perform an experiment, and give useful details. Choose a sentence, perhaps “the quick brown fox jumps over the lazy dog”. Each student will see how many letters they can write in 1 minute by writing out the chosen sentences as many times as possible in the timed minute.
Randomly allocate whether the students will be writing with their awkward hand or writing backwards. Time a minute, get them to count the number of letters written and collect the results. This will generate two quite small samples, so it would be good to combine with another class if possible.
The data can now be displayed using dot plots and box plots.
Alternatively
The data is collected as ordered pairs for each student (awkward hand, writing backwards) the data can be displayed on a scatter diagram and trends noted.
How dominant is our dominant hand
This activity is related to the above activity but may be done independently. The aim of the activity is to find how dominant the use of one hand is over the other and whether this factor varies among individuals.
Students are asked to write as many x’s as they can in one minute using their left hand. The activity is repeated using their right hand.
Results are collected as ordered pairs (left hand, right hand), plotted on a scatter plot and trends and exceptions noted.
Power jump

Equipment
- Ruler
- Introduction to collection of statistical information
Method
To measure a student’s power jump they need to stand next to a vertical wall. Raise one of their arms, bend knees and jump as high as possible.
Their power jump is the distance between where they raised their arm standing to the top height of their jump.
Students can investigate student’s height vs their power jump distance, or the height to the top of their extended arm vs their power jump distance or…
Students need to record the class information and also present the information appropriately.
- What information does your presentation suggest?
- Do certain groups of people have a better power jump than others? Explain.
Last updated September 6, 2018
TOP


