Activity: How many babies
AOs |
Indicators |
Outcomes |
Snapshot |
Learning experiences
Extension ideas |
Assessment |
Spotlight |
Links
Purpose
Understand the effect of changing parameters on probability distributions.
Achievement objectives
S8-4 Investigate situations that involve elements of chance:
- C – applying distributions such as the Poisson, binomial, and normal
Indicators
C. Applying distributions such as the Poisson, binomial, and normal:
They learn that some situations that satisfy certain conditions can be modelled mathematically. The model may be
Poisson,
binomial,
normal, uniform, triangular, or others, or be derived from the situation being investigated.
- Recognises situations in which probability distributions such as
Poisson,
binomial, and
normal are appropriate models, demonstrating understanding of the assumptions that underlie the distributions.
- Selects and uses an appropriate distribution to solve a problem, demonstrating understanding of the way a probability distribution changes as the parameter values change.
Specific learning outcomes
Students will be able to:
- sketch the shape of a Poisson distribution given the mean
- describe how the shape of a Poisson distribution will change as the mean changes.
Diagnostic snapshot(s)
- Prior knowledge of Poisson, normal, binomial distributions.
- Which distribution would be useful to model the number of births per day in a hospital?
TOP
Planned learning experiences
Changing parameters: How many babies?
The number of babies born in a hospital each day is unpredictable. Birthing units in hospitals have to plan the number of beds and staff available to meet the expected number of births, but need to be flexible to because the number varies from day to day.
Think pair share
Is there a theoretical distribution which could be used to model the number of births per day in Waitakere hospital? Justify your answer.
Discussion
Why might number of births be modelled by a Poisson distribution? What are the parameter(s) of the distribution? What assumptions would you need to make? Is there another distribution which might be used? Using the Poisson distribution, how often would you expect there to be 24 births in one day at Waitakere Hospital?
Mini-whiteboards
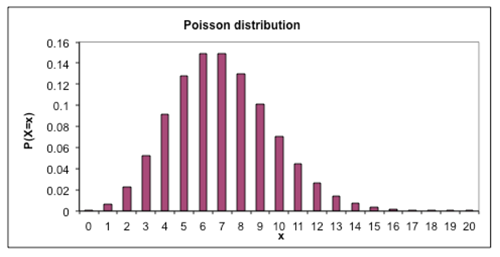
Draw a picture of what you think the distribution of the number of births per day at Waitakere hospital would look like. Teacher shows Excel (or other) demonstration with data projector.
Class discussion
What do you notice? Is it what you expected? How is it different from what you drew? The real data should be more variable than the model.
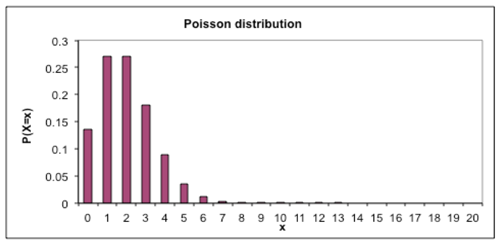
The Helensville Birthing Centre has an average of two births per day.
Think pair share with mini-whiteboards
Draw the distribution of number of births per day that you would expect to see at the Helensville Birthing Centre.
Compare what you have drawn to your neighbour’s graph, then discuss in groups of about 4. Can a Poisson distribution be used to model this situation? What would the distribution look like?
Whole class discussion
Is a Poisson model appropriate? What would the distribution look like?
Teacher demonstration with Excel or other technology.
Class discussion
What do you notice? Is that what you expected?
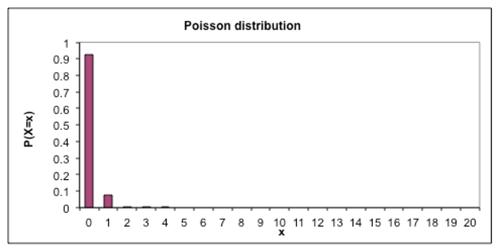
Rawene in Northland has had a birthing unit since 1910. They used to have 30 births a year. Is there a distribution which could be used to model the number of births per day?
Discuss
How many births per day is that?
Mini-whiteboards
Draw the distribution you would expect to see if the number of births per day was 0.08. Discuss reasons for student shapes, then demonstrate Poisson distribution using software (graphics calculator, spreadsheet…). What do you notice?
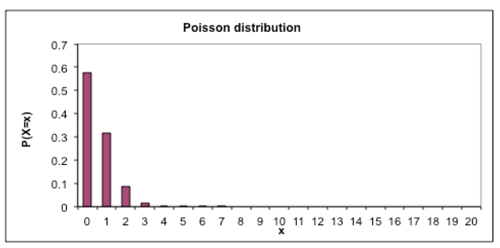
In the 1930s, Rawene hospital started offering pain relief and the number of births jumped to 200 per year. How would the distribution of births per day change? Draw the distribution you would now expect on your mini-whiteboards. Compare the drawings to teacher demonstration. How often would you expect to have more than one birth in a day? How many days in a year would have no births?
Back in Helensville, the increase in the number of births by caesarean section is expected to reduce the number of births per day at the Waitakere unit.
Mini-whiteboards
Draw the distribution of the number of births per day you would expect if there were 4 births per day? How often would you expect to get a day with no births or with 2 births per day?
If the data allows, splitting series by birth type may give more insights. Births may be modelled by a Poisson distribution only because of the assumed binomial situation: in the hospital’s catchment area - there are N women at risk of pregnancy, all with the same probability, p. Students should be able to recognise some of these assumptions are dubious. We’d assume N, p to be constant but hospitals may have a limit on the maximum number of births, and may juggle procedures.
Think pair share
Could you use the same theoretical distribution to model the number of births per day in Auckland? Why or why not?
Class discussion
What do you think is the average number of births per day in Auckland? How did you come up with that number? Actual number of births in Auckland is about 23 000 per year.
Mini-whiteboards
What would the distribution of the number of births per day look like? Compare to teacher demonstration.
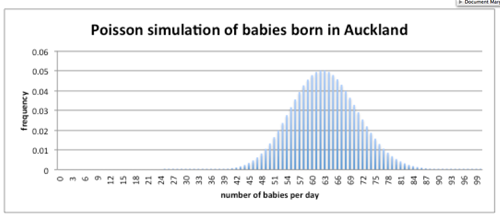
Discuss which distribution could be used to model the number of births per day in Auckland. What would be important in making the decision of which distribution to use? With the software available now there is no need to model a discrete distribution with a normal distribution. Software enables the Poisson distribution model to be used if that is appropriate. There is no need to make a continuity correction in order to use the normal distribution.
What information would you need to decide if the distribution of births in Auckland can be modelled by a Poisson distribution? To see if Poisson model is a ‘good’ model for this situation, test it with some actual data from Auckland Hospital. That is, compare the shape of the actual distribution and the model using the estimated parameter.
Possible adaptations to the activity
- A similar approach could be used to explore the effects of changing the parameters on the normal distribution or the binomial distribution.
- Given the graph of a distribution and information about the context, identify the parameters of the distribution.
TOP
Extension/enrichment ideas
- Students could find real world contexts which could be modelled by theoretical distributions, justifying their choice, and discussing the assumptions made.
- How could the theoretical distribution be used to help plan the number of beds and staffing at a hospital? By checking how well the model fits the data ... and it may not be a good fit. However, it may still useful if the tail events behave like the model.
Planned assessment
This teaching and learning activity could lead towards assessment in the following achievement standards:
Spotlight on
Pedagogy
Creating a supportive learning environment
In a supportive learning environment the teacher is:
- accepting all student responses as part of the learning process
- being aware of literacy implications of mathematical and statistical tasks.
Teaching as inquiry
Key questions for teachers to ask of their teaching practice:
- What happened as a result of the teaching? And what are the implications for future teaching?
Examples of teacher actions to support teaching as inquiry:
- Understanding student’s misconceptions and devising appropriate teaching responses.
Key competencies
Thinking
- Students deal with uncertainty and variation, they seek patterns and generalisations.
Values
- Students will be encouraged to value:
- innovation, inquiry, and curiosity, by thinking critically, creatively, and reflectively.
Māori/Pasifika
Planning for content and language learning
Links
Last updated September 10, 2018
TOP


