Glossary page V
Variability
The tendency for a property to have different values for different individuals or to have different values at different times.
Curriculum achievement objectives references
Statistical investigation: Levels (1), (2), (3), (4), (5), (6), 7, (8)
Probability: Levels (1), (2), (3), (4), (5), (6), (7), (8)
Variable
A property that may have different values for different individuals or that may have different values at different times.
Curriculum achievement objectives references
Statistical investigation: Levels 4, 5, 6, 7, (8)
Probability: Levels (7), 8
Variance
A measure of spread for a distribution of a numerical variable that determines the degree to which the values differ from the mean. If many values are close to the mean, then the variance is small, and if many values are far from the mean, then the variance is large.
It is calculated by the average of the squares of the deviations of the values from their mean.
The variance can be influenced by unusually large or unusually small values.
The positive square root of the variance is equal to the standard deviation.
It is recommended that a calculator or software is used to calculate the variance. On a calculator, the square of the standard deviation will give the variance.
See: measure of spread, sample variance, standard deviation
Curriculum achievement objectives references
Statistical investigation: Levels (7), (8)
Variance (of a discrete random variable)
A measure of spread for a distribution of a random variable that determines the degree to which the values of a random variable differ from the expected value.
The variance of random variable X is often written as Var(X) or σ2 or σ2x.
For a discrete random variable, the variance is calculated by summing the product of the square of the difference between the value of the random variable and the expected value, and the associated probability of the value of the random variable, taken over all of the values of the random variable.
In symbols, Var(X) = (x - i)2P(X = x)
An equivalent formula is Var(X) = E(X2) – [E(X)]2
The square root of the variance is equal to the standard deviation.
Example
Random variable X has the following probability function:
Probabilities for a random variable X.
| x
| 0
| 1
| 2
| 3
|
| P(X = x)
| 0.1
| 0.2
| 0.4
| 0.3
|
Using Var(X) = (x - i)2P(X = x)
µ = 0 x 0.1 + 1 x 0.2 + 2 x 0.4 + 3 x 0.3
= 1.9
Var(X) = (0 – 1.9)2 + (1 – 1.9)2 + (2 – 1.9)2 + (3 – 1.9)2
= 0.89
Using Var(X) = E(X2) – [E(X)]2
E(X) = 0 x 0.1 + 1 x 0.2 + 2 x 0.4 + 3 x 0.3
= 1.9
E(X2) = 02 × 0.1 + 12 × 0.2 + 22 × 0.4 + 32 × 0.3
= 4.5
Var(X) = 4.5 – 1.92
= 0.89
See: population variance, variance
Curriculum achievement objectives reference
Probability: Level (8)
Variation
The differences seen in the values of a property for different individuals or at different times.
Curriculum achievement objectives references
Statistical investigation: Levels 4, 5, 6
Probability: Levels (1), (2), (3), 4, 5, (6), (7), (8)
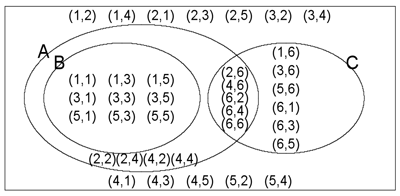
Venn diagram
A diagram used to illustrate the relationship between events in a probability activity in which events are represented by ovals (or circles). When different events share some outcomes the ovals overlap. The ovals are usually drawn within a rectangle which represents all possible outcomes of the probability activity.
Example
When considering the rolling of two six-faced dice events A, B and C are defined as:
- A is the event that the total is an even number,
- B is the event that both numbers are odd, and
- C is the event that at least one of the numbers is a six.
The following Venn diagram represents these events.

If you cannot view or read this diagram/graph, select this link to
open a text version.
Curriculum achievement objectives references
Probability: Levels (7), (8)
Last updated October 21, 2013
TOP


