Glossary page L
Least-squares regression line
The most common method of choosing the line that best summarises the linear
relationship
(or
linear trend
) between the two
variables
in a
linear regression
analysis, from the
bivariate data
collected.
Of the many lines that could usefully summarise the linear relationship, the least-squares regression line is the one line with the smallest sum of the squares of the
residuals
.
Two other properties of the least-squares regression line are:
- The sum of the residuals is zero.
- The point with
x
-coordinate equal to the
mean
of the x-coordinates of the observations and with
y
-coordinate equal to the mean of the
y
-coordinates of the observations is always on the least-squares regression line.
Curriculum achievement objectives reference
Statistical investigation: Level (8)
Likelihood
The notion of an
outcome
being probable. Likelihood is sometimes used as a simpler alternative to
probability
.
In a situation involving elements of
chance
,
equal likelihoods
mean that, for any trial, each outcome has the same chance of occurring.
Similarly,
different likelihoods
mean that, for any trial, not all of the outcomes have the same chance of occurring.
Curriculum achievement objectives reference
Probability: Level 2
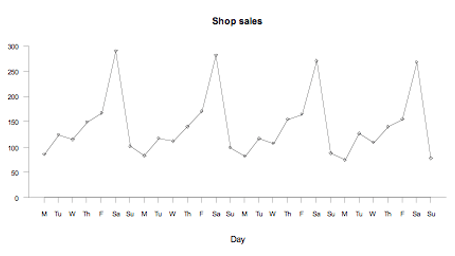
Line graph
A graph, often used for displaying
time-series data
, in which a series of points representing individual observations are connected by line segments.
Line graphs are useful for showing changes in a
variable
over time.
Example
Daily sales, in thousands of dollars, for a hardware store were recorded for 28 days. These
data
are displayed on the line graph below.
If you cannot view or read this graph, select this link to
open a text version
.
Curriculum achievement objectives references
Statistical investigation: Levels (3), (4), (5), (6), (7), (8)
Linear combination (of random variables)
A way of combining two or more
random variables
in which each random variable is multiplied by a number and all of these are then added.
Example
If
X
and
Y
are random variables then
T
= 2
X
+ 3
Y
is a linear combination of
X
and
Y
.
Curriculum achievement objectives reference
Probability: Level 8
Linear regression
A form of statistical analysis that uses
bivariate data
(where both are
numerical variables
) to examine how knowledge of one of the
variables
(the
explanatory variable
) provides information about the values of the other variable (the
response variable
). The roles of the explanatory and response variables are therefore different.
When the bivariate
numerical data
are displayed on a
scatter plot
, the
relationship
between the two variables becomes visible. Linear regression fits a straight line to the
data
that is added to the scatter plot. The fitted line helps to show whether a linear regression
model
is a good fit to the data.
If a linear regression model is appropriate, then the fitted line (
regression line
) is used to predict a value of the response variable for a given value of the explanatory variable and to describe how the values of the response variable change, on average, as the values of the explanatory variable change.
An appropriately fitted linear regression model estimates the true, but unknown, linear relationship between the two variables and the underlying system the data was taken from is regarded as having two components:
trend
(the general linear tendency) and
scatter
(
variation
from the trend).
Note: Linear regression can be used when there is more than one explanatory variable, but at level 8 only one explanatory variable is used. When there is one explanatory variable, the method is called
simple linear regression
.
Curriculum achievement objectives reference
Statistical investigation: Level 8
Linear transformation
(of a random variable)
A change to a
random variable
made by one or more of the following operations:
- adding or subtracting a number
- multiplying or dividing by a number.
Example
If
X
is a random variable then
T
= 2
X
+ 3 is a linear transformation of
X
.
Curriculum achievement objectives reference
Probability: Level 8
Lower quartile
See:
quartiles
Curriculum achievement objectives references
Statistical investigation: Levels (5), (6), (7), (8)
Last updated October 16, 2013
TOP