Glossary page E
Estimate
An assessment of the value of an existing, but unknown, quantity.
In sampling, an estimate is a number calculated from a
sample
, often a
random sample
, which is used as an approximate value for a
population parameter
.
In
numerical bivariate data
,
linear regression
may be used to estimate the value of one
numerical variable
based on the value of the other numerical variable.
In probability, an
experimental estimate of a probability
may be used to estimate a
true probability
and a
theoretical probability
(from a probability
model
) may be used to estimate a true probability.
Example
A
sample mean
, calculated from a random sample taken from a
population
, is an estimate of the
population mean
.
Alternatives:
point estimate
(in sampling or linear regression),
experimental estimate of a probability
(in probability)
See (statistical investigation):
forecast
,
interval estimate
,
prediction
,
statistic
See (probability):
experimental estimate of a probability
,
theoretical probability
Curriculum achievement objectives references
Statistical investigation: Levels (6), 7, 8
Probability: Levels 3, 4, 5, 6, 7, 8
Event
A collection of
outcomes
from a
probability activity
or a situation involving an element of
chance
.
An event that consists of one outcome is called a
simple event
. An event that consists of more than one outcome is called a
compound event
.
Example 1
In a situation where a person will be selected and their eye colour recorded,
blue
,
grey
, or
green
is an event (consisting of the 3 outcomes: blue, grey, green).
Example 2
In a situation where two dice will be rolled and the numbers on each die recorded, a
total of 5
is an event, consisting of the 4 outcomes (1, 4), (2, 3), (3, 2), (4, 1), where (1, 4) means a 1 on the first die and a 4 on the second.
Example 3
In a situation where a person will be selected at random from a
population
and their weight recorded,
heavier than 70 kg
is an event.
Curriculum achievement objectives references
Probability: Levels (5), (6), (7), 8
Expected value (of a
discrete random variable
)
The
population mean for a random variable
and is therefore a
measure of centre
for the
distribution
of a random variable.
The expected value of random variable
X
is often written as E(
X
) or
µ
or
µ
X
.
The expected value is the ‘long-run
mean
’ in the sense that, if as more and more values of the random variable were collected (by sampling or by repeated trials of a
probability activity
), the
sample mean
becomes closer to the expected value.
For a discrete random variable, the expected value is calculated by summing the product of the value of the random variable and its associated
probability
, taken over all of the values of the random variable.
In symbols, E(X) =

Example
Random variable X has the following
probability function
:
Probability function values.
|
x
|
0
|
1
|
2
|
3
|
| P(
X
=
x
)
|
0.1
|
0.2
|
0.4
|
0.3
|
A
bar graph
of the probability function, with the expected value labelled, is shown below.
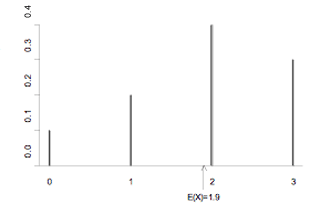
If you cannot view or read this graph, select this link to
open a text version
.
See:
population mean
Curriculum achievement objectives reference
Probability: Level 8
Experiment
In its simplest meaning, a process or study that results in the collection of
data
, the outcome of which is unknown.
In the statistical literacy thread at level 8, experiment has a more specific meaning. Here an experiment is a study in which a researcher attempts to understand the effect that a
variable
(an
explanatory variable
) may have on some phenomenon (the response) by controlling the conditions of the study.
In an experiment the researcher controls the conditions by allocating individuals to groups and allocating the value of the explanatory variable to be received by each group. A value of the explanatory variable is called a
treatment
.
In a well-designed experiment, the allocation of subjects to groups is done using
randomisation
. Randomisation attempts to make the characteristics of each group very similar so that if each group was given the same treatment, the groups should respond in a similar way, on average.
Experiments usually have a
control group
, a group that receives no treatment or receives an existing or established treatment. This allows any differences in the response, on average, between the control group and the other group(s) to be visible.
When the groups are similar in all ways apart from the treatment received, then any observed differences in the response (if large enough) among the groups, on average, is said to be caused by the treatment.
Example
In the 1980s, the Physicians’ Health Study investigated whether a low dose of aspirin had an effect on the risk of a first heart attack for males. The study participants, about 22 000 healthy male physicians from the United States, were randomly allocated to receive aspirin or a
placebo
. About 11 000 were allocated to each group.
This is an experiment because the researchers allocated individuals to two groups and decided that one group would receive a low dose of aspirin and the other group would receive a placebo. The treatments are aspirin and placebo. The response was whether the individual had a heart attack during the study period of about five years.
See:
causal-relationship claim, placebo, randomisation
Curriculum achievement objectives references
Statistical investigation: Levels 5, (6), 7, 8
Statistical literacy: Level 8
Experimental design principles
Issues that need to be considered when planning an
experiment.
The following issues are the most important:
Comparison and control:
Most experiments are carried out to see whether a
treatment
causes an effect on a phenomenon (response). In order to see the effect of a treatment, the treatment group needs to be able to be compared fairly to a group that receives no treatment (control group). If an experiment is designed to test a new treatment then a control group can be a group that receives an existing or established treatment.
Randomisation:
A randomising method should be used to allocate individuals to groups to try to ensure that all groups are similar in all characteristics apart from the treatment received. The larger the group sizes, the better the balancing of the characteristics, through randomisation, is likely to be.
Variability:
A well-designed experiment attempts to minimise unnecessary variability. The use of random allocation of individuals to groups reduces variability, as does larger group sizes. Keeping experimental conditions as constant as possible also restricts variability.
Replication:
For some experiments, it may be appropriate to carry out repeated measurements. Taking repeated measurements of the
response variable
for each selected value of the
explanatory variable
is good experimental practice because it provides insight into the variability of the response variable.
Curriculum achievement objectives reference
Statistical investigation: Level 8
Experimental distribution
The
variation
in the values of a
variable
obtained from the results of carrying out trials of a situation that involves elements of
chance
, a
probability activity
, or a statistical
experiment
.
For
whole-number data
, an experimental distribution may be displayed:
- in a table, as a set of values and their corresponding
frequencies
,
- in a table, as a set of values and their corresponding
proportions
or
experimental probabilities
, or
- on an appropriate graph such as a
bar graph
.
For
measurement data
, an experimental distribution may be displayed:
- in a table, as a set of intervals of values (
class intervals
) and their corresponding frequencies,
- in a table, as a set of intervals of values (class intervals) and their corresponding proportions or experimental probabilities, or
- on an appropriate graph such as a
histogram
,
stem-and-leaf plot
,
box and whisker plot
or
dot plot
.
For
category data
, an experimental distribution may be displayed:
- in a table, as a set of categories and their corresponding frequencies,
- in a table, as a set of categories and their corresponding proportions or experimental probabilities, or
- on an appropriate graph such as a bar graph.
A
sample distribution
is sometimes called an experimental distribution.
Alternative: empirical distribution
See:
distribution
,
sample distribution
Curriculum achievement objectives references
Statistical investigation: Levels (4), 5, 6, 7, 8
Probability: Levels 4, 5, 6, 7
Experimental
estimate of a
probability
An
estimate
of the
probability
that an event will occur calculated from trials of a probability activity by dividing the number of times the event occurred by the total number of trials.
When an experimental estimate of a probability is based on many trials the experimental estimate of a probability should be a close approximation to the true probability of the event.
Curriculum achievement objectives references
Probability: Levels 3, 4, 5, 6, 7, 8
Experimental unit
An object that will be studied in an
experiment
. Depending on the purpose of the experiment, an experimental unit can be a physical entity such as a person, an animal, a machine, a plot of land, or, when the purpose is about a process such as ball throwing, an experimental unit can be a non-physical entity such as a throw of a ball.
Curriculum achievement objectives references
Statistical investigation: Levels (7), (8)
Explanatory variable
The
variable
, of the two variables in
bivariate data
, and the knowledge of it, which may provide information about the other variable, the
response variable
. Knowledge of the explanatory variable may be used to predict values of the response variable, or changes in the explanatory variable may be used to predict how the response variable will change.
If the bivariate data result from an
experiment
, then the explanatory variable is the one whose values can be manipulated or selected by the experimenter.
In a
scatter plot
, as part of a
linear regression
analysis, the explanatory variable is placed on the
x
-axis (horizontal axis).
Alternatives:
independent variable
, input variable, predictor variable
Curriculum achievement objectives reference
Statistical investigation: Level (8)
Exploratory data analysis
The process of identifying
patterns
and
features
within a
data set
by using a wide range of graphs and
summary statistics
. Exploratory data analysis usually starts with graphs and summary statistics of single
variables
and then extends to pairs of variables and further combinations of variables.
Exploratory data analysis is an essential part of the
statistical enquiry cycle
. It is important at the
cleaning data
stage because graphs may reveal
data
that need checking with regard to quality of the data set.
For data sets about
populations,
exploratory data analysis will reveal important features of the population, and for data sets from
samples
, it will reveal features of the sample that may suggest features in the population from which the sample was taken.
For
bivariate numerical data
, exploratory data analysis will indicate whether it is appropriate to fit a
linear regression model
to the data.
For
time-series data
, exploratory data analysis will indicate whether it is appropriate to fit an
additive model
to the time-series data.
Curriculum achievement objectives references
Statistical investigation: Levels (1), (2), (3), (4), (5), (6), 7, 8
Extrapolation
The process of estimating the value of one
variable
based on knowing the value of the other variable, where the known value is outside the range of values of that variable for the
data
on which the estimation is based.
Curriculum achievement objectives references
Statistical investigation: Levels 7, (8)
Last updated October 16, 2013
TOP